How To Calculate Volumetrics With Grids |
|
The Map Modules Compute Volume from a Grid tool calculates volumetrics from a single grid. With a good quality isopach, pore volume, or hydrocarbon pore volume grid, this method can generate accurate estimations of the area occupied by hydrocarbons, and can divide these volumetrics into different lease polygons. When to use a Grid-Based ApproachPetra can calculate reservoir volumetrics in two different ways:
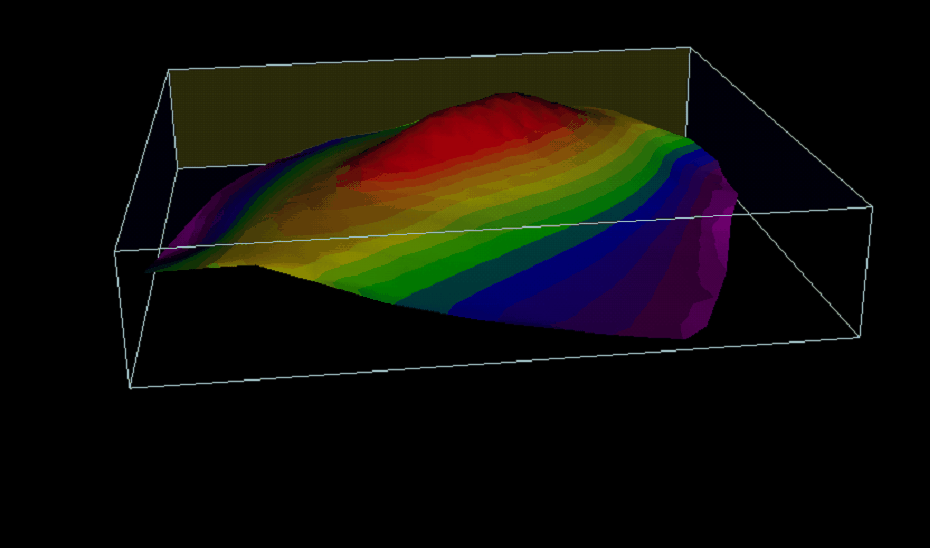
How Grid-Based Volumetrics WorksWhen Petra calculates a grid from a data set (such as pay thickness or porosity measured at each well), it creates a surface that interpolates the values across the empty spaces between data points. In the simplest case, an isopach grid of net pay thickness reflects the thickness of pay (the Z value) at every point on a map (X and Y for Lat and Long). The example below is an isopach grid projected into three-dimensional space. The volume underneath the surface of the isopach grid (down to zero feet thick) equals the volume of the reservoir. Given a good grid that accurately maps the subsurface, this method can generate much more precise measurements of the volume of a reservoir than conventional estimation.
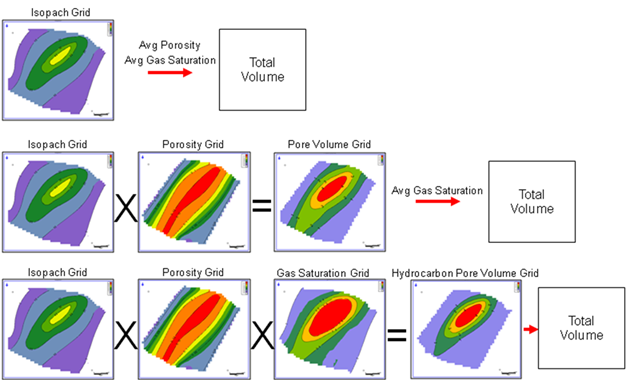
This same grid-based volumetrics can also increase accuracy in heterogeneous reservoirs. Both porosity and water saturations often vary significantly across an entire reservoir. Deterministic calculations force a single average porosity and water saturation, which can easily ignore these effects. In contrast, multiplying individually mapped grids of reservoir thickness, porosity, and hydrocarbon saturation together can generate a more accurate picture of the total volume occupied by hydrocarbons. The diagram below shows how different kinds of grids can be used to calculate volumetrics in an oil and gas context. The red arrow on each line shows when the volumetrics calculation is performed, and which assumptions are made during the calculation. The first example shows a simple isopach grid; calculating a total volume of oil or gas requires an assumed average porosity and gas saturation. The second example shows an isopach and porosity grid. Multiplying these together generates a pore volume grid, which gives the distribution of pore space footage. Calculating volumetrics here requires an average gas saturation. The final example multiplies an isopach, porosity, and gas saturation grid together to form a hydrocarbon pore volume (HPV) grid. Since this HPV grid already calculates the distribution of hydrocarbons in the system, it needs no further assumed reservoir variables.
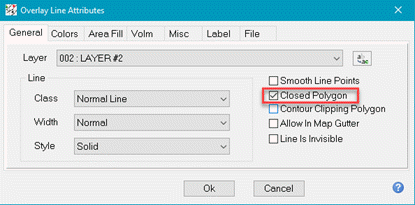
Initial Polygon SetupVolumetrics can be calculated for the grid as a whole, or only for the grid underneath active overlay polygons on the Map Module. While this is most used for assessing volumetrics in individual leases, volumetric polygons can also be used to outline a specific area of interest or to eliminate the effect of large but unproductive areas. To use polygons, select the overlay line in the map module and double-click to bring up the lines attributes. On the General tab, make sure that the line is a closed polygon.
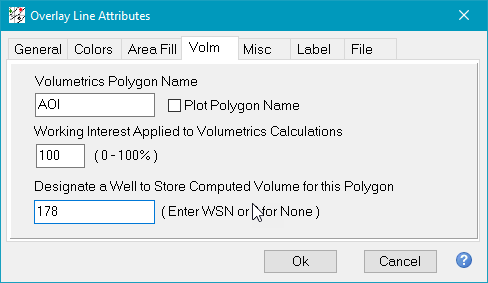
Next, select the Volm tab to edit the polygons name and working interest. The calculations made inside this polygon will be referenced by this name. While this is most used for assessing volumetrics in individual leases, volumetric polygons can also be used to outline a specific area of interest or to eliminate the effect of large but unproductive areas. In the example below, the selected polygons volumetrics name is AOI and its WI is 100%. You can also designate a specific wells WSN to store the specific polygons calculated volume. Remember that a wells WSN number is the number Petra assigns to the well when it is created in the project; it is not the API or UWI number. This volume is stored in the wells zone data, and is set up during the volumetrics process. In the example below, volumetric data for this AOI polygon will be stored in the well with a WSN of 178.
Petra will calculate volumetrics for all visible polygons with a volumetric name, so be sure to turn off all irrelevant named polygons before proceeding. Calculating Volumetrics - Data tabMap: Contours > Volumetrics > Compute Volume From a GridOnce the overlay volumetric polygons are set-up, open the volumetrics toolfrom the Map Module menu bar Contours >Volumetrics > Compute Volume From a Grid . Here, select the grid and grid type to be used in the calculation from the dropdown labeled Grid File Used For Volumes. To change the grid directory, select a different file path on the Dir tab. Grids on this dropdown menu can be sorted alphabetically by selecting the
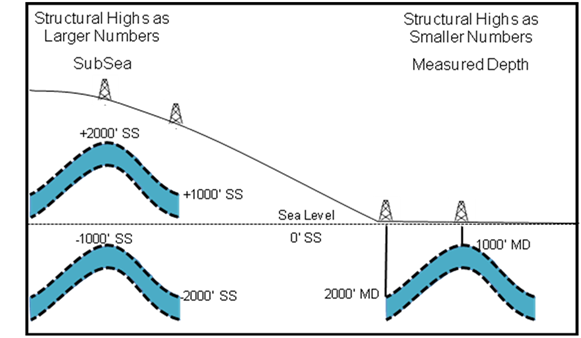
Grid UnitsWhen calculating volumetrics, its important to make sure the units are correct. Petra stores the default XY and depth units of measurement (feet or meters) in the Map Projections Settings. When Petra calculates a grid, it uses these XY coordinate units. The units used to create the selected grid are shown under Grid XY Units. By default, Petra assumes that the Z units for the grid are the Default Depths Units selected on the Map Projection Settings. Make sure the units selected here reflect the units of the grid. Grid Type - ISOThe Grid Type dropdown tells Petra what the numerical values in the grid actually mean. A grid used in volumetrics can be one of three types: Iso type data with values from zero to positive numbers, structure data with structural highs as larger numbers, or structural data with structural highs as smaller numbers. In the example below, the SCMR ISOPACH grid is selected as an isopach. With ISO grids (including isopach grids, pore volume grids, and hydrocarbon pore volume grids), Petra uses the thickness to calculate the volume underneath the grid nodes. This is the most common and easiest way to calculate volumetrics with a grid. Note that Petra will ignore the effect of negative numbers in ISO type grids. Grid Type - StructureThough Petra can use a structure grid in a volumetric calculation, it is almost always better to use an isopach grid. In practice, using a structure grid really only works with small, simple structures with a thick, homogenous reservoir and a discrete water contact. The numerical representation of a structural high or low is dependent on the reference datum (Measured Depth/MD or SubSea/SS). SS grids store structural highs as larger numbers (e.g. +2,000 SS is higher than +1,000 SS and -1,000 SS is higher than -2,000 SS). MD grids store structural highs as smaller numbers (e.g. 1,000 MD is higher than 2,000 MD). Practically, grids referenced to SS use the Structural Highs as Larger Numbers option, while grids referenced to MD use Structural Highs as Smaller Numbers" option.
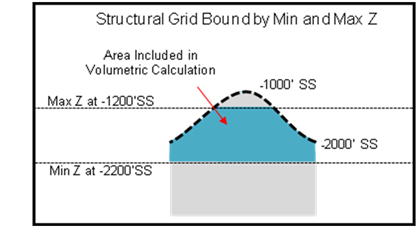
A single structure map only represents the elevations of a surface and doesn't inherently have any measurement of thickness. When using a structure map, Petra calculates thickness by using the volume of the grid between the minimum and maximum Z values set on the Data tab. In the example below, Petra will calculate a thickness between -1200 SS and -2200 SS. It is important to note that setting a limit below the bottom of the grid will add a large extra bulk to the volumetric calculation. The example below will have an additional 200 of section added to the volumetric calculation.
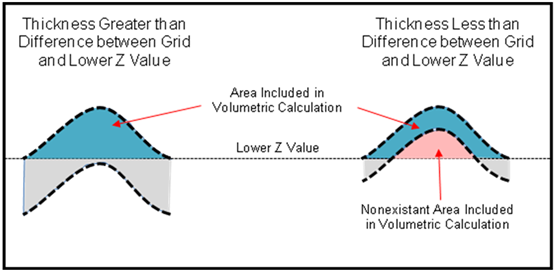
Calculating volumetrics with a structure map can also lead to problems if the thickness of the reservoir rock is thinner than the difference between the grid and the bounding lower z value. With a sufficiently thick reservoir, the bounds are completely covered by reservoir rock. With thinner reservoirs, the volumetric calculation can include a volume that doesn't actually include reservoir rock, thus overestimating the volume.
Compute Volume for Following Area(s)This section tells Petra whether the volume underneath a grid will be broken out by different volumetric polygons. The Generate Volumes for Each Visible Overlay Volumetric Polygon option will calculate the volume of the grid covered by every visible overlay polygon. Recall that a line defining these polygons need to be closed on the line's General tab and named on the line's Volm tab. If these polygons overlap, Petra will count the volume of the shared area twice. Setting this option to Generate Volume For Entire Grid Only will instead ignore visible polygons and calculate the volume over the entire grid. Compute Volumes BetweenThe Minimum and Maximum Z values set limits on the overall volumetric calculation. Though these settings are critical when using a structure grid, the limits can also be useful when calculating volumetrics on thickness or iso maps. In particular, setting the limits can help to reduce the effect of a large, thin uneconomic area on the calculation. Horizontal Slice VolumesIt is also possible to calculate volumetrics for horizontal slices from the minimum z value to the maximum z value through the reservoir. In the example below, horizontal slices will be calculated for 0-10 of thickness, 10-20, 20-30, and so on through the entire section. With large grids and small increments, this additional step can be fairly time-consuming. Options tabThe Options tab provides a few more options for the volumetrics calculation.
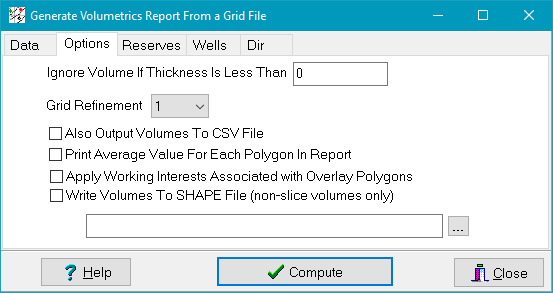
Ignore Volume if Thickness is Less Than - This option sets the minimum thickness necessary for Petra to consider in the volumetric calculation; anything below this thickness isn't included. By default, this thickness cutoff is set at zero, which means that all the entire positive volume of the grid is used. Setting this thickness higher can help to reduce the influence of a large thin or uneconomic area. Note that the cutoff thickness is relative to the selected grid units a 10 cutoff applied to an isopach grid is very different than a 10 cutoff applied to a HPV grid. Grid Refinement - The Grid Refinement option breaks larger grid cells into smaller triangular areas. This slightly increases the accuracy of the volumetrics calculation at the cost of more computing time. Also Output Volumes to CSV File - The Also Output Volumes to CSV File option writes a CSV file containing the name, area (both a total area of the polygon and the total area of the grid underneath the polygon), relevant calculated volume, an average grid thickness (if selected), the working interest, and the WSN of the polygons designated well, Petra creates a CSV file using the volumetric grid name in the project's GRIDS directory. Using the example above, Petra creates a file named HPV.CSV. Leaving this CSV file open while trying to calculate a new volume (and thus export data to the same CSV file) can create an IO error.
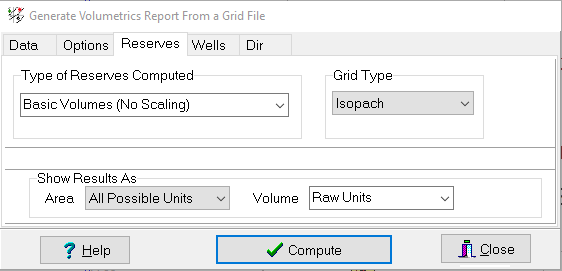
Print Average Value for each Polygon in Report - This option simply calculates the average grid thickness for each visible named polygon. What this thickness actually represents depends on the type of the grid used. The average Z value for a structure grid will be an average elevation rather than an average thickness. Apply Working Interests Associated with Overlay Polygons - This option scales each volume inside a volumetrics polygon by the working interest. Write Volumes to SHAPE FILE - This option saves currently visible volumetric polygons and data to a shape file. Select the option and navigate to the desired shape file. This copies all currently visible volumetric polygons to a single shape file. Reserves tabThe Reserves tab selects the type of reserves calculation and specifies the type of input grid. The reserves types include basic volumes, recoverable oil in place, recoverable gas in place, coal bed methane, and coal tonnage. The map type tells Petra whether the input grid is an isopach, a pore volume map, or a hydrocarbon pore volume map. The Map Type only affects oil and gas reserve calculations. The options on the Reserves tab changes depending on the selected reservoir and map type. Similarly, the area and volume dropdowns at the bottom of the window show the relevant units for the specific reserves calculation. Basic Volumes (No Scaling)The simplest form of a volumetric calculation is the first option, Basic Volumes (No Scaling). This option simply calculates the volume occupied by the grid without any additional reservoir calculations. Note that the Map Type option has no effect on this calculation. The Basic Volume calculation can display results in a variety of areas and formats. For area, the available units include raw units (as defined on the Units tab), square feet, square meters, and acreage. For volume, the available units include raw units (as defined on the Units tab), cubic feet, acre-feet, acre-meters, MBO, MMCF, and cubic meters.
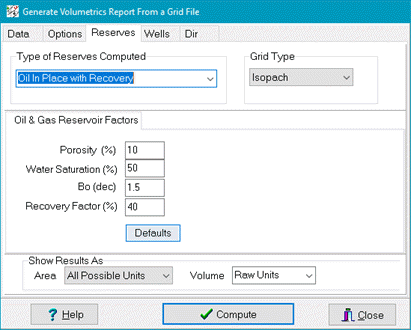
Oil in Place with RecoveryPetra's oil reserves calculations multiplies the total area of pore space occupied by hydrocarbons by a recovery factor. This volume is then divided by Bo to correct for differences in volume between hydrocarbons in the reservoir and the same hydrocarbon at surface conditions. Recoverable Oil In Place: ROIP = Volume*Por*(1-Sw)*Rf / Bo The three options for Map Type (isopach, pore volume, and hydrocarbon pore volume) simply tell Petra what the selected grid represents. Practically, the map type grays out irrelevant options. An isopach grid just contains thickness and will need an average water saturation and porosity. A pore volume grid already contains the thickness and porosity information and just needs average water saturation. A hydrocarbon pore volume grids already contains all this information, and therefore needs no averaged porosity and saturation information. The Oil In Place with Recovery calculation can display results in a variety of areas and formats. For area, the available units include raw units (as defined on the Units tab), square feet, square meters, and acreage. For volume, the available units include raw units (as defined on the Units tab), cubic feet, acre-feet, acre-meters, or MBO.
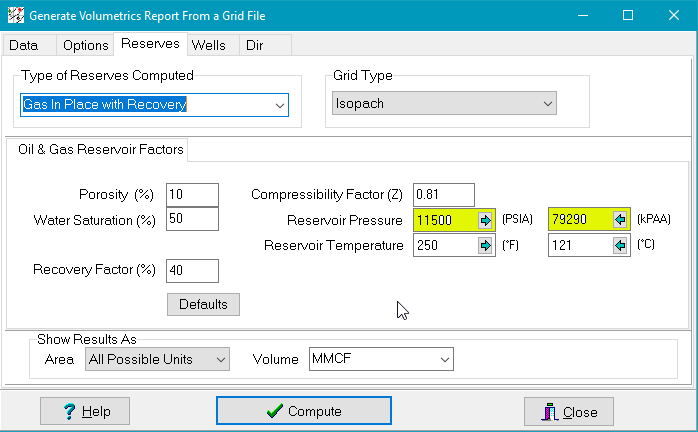
Gas in Place with RecoveryPetra's oil reserves calculations multiplies the total area of pore space occupied by hydrocarbons by a recovery factor. This volume is then divided by Bg to correct for differences in volume between hydrocarbons in the reservoir and the same hydrocarbon at surface conditions. Gas In Place: GIP = Volume*Por*(1-Sw)*Rf / Bg Where Bg = Patm/P*(460+T/460+60)*Z; Patm = 1 The three options here for Map Type (isopach, pore volume, and hydrocarbon pore volume) simply tell Petra what the selected grid represents. Practically, the map type grays irrelevant options out. An isopach grid just contains thickness and will need an average water saturation and porosity. A pore volume grid already contains the thickness and porosity information and just needs average water saturation. A hydrocarbon pore volume grids already contains all this information, and therefore needs no averaged porosity and saturation information. The recoverable gas in place calculation also requires a compressibility factor, reservoir pressure, and reservoir temperature. The calculation only uses the numbers on the imperial units side; SI units must be converted to imperial units. Using imperial units is fairly simple simply enter the reservoir pressure and temperature in PSI and °F into the boxes on the left (highlighted in yellow) To use SI units, enter in the pressure and temperature in kPAA and °C into the boxes on the right (not highlighted) and select the arrow buttons The Gas In Place with Recovery calculation can display results in a variety of areas and formats. For area, the available units include raw units (as defined on the Units tab), square feet, square meters, and acreage. For volume, the calculation is limited to MMCF.
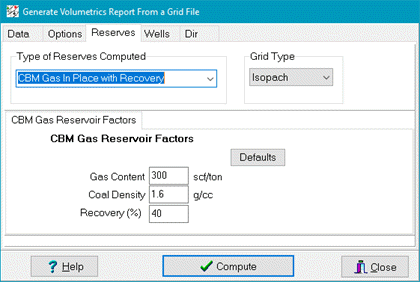
Coal Bed Methane (CBM) in Place with RecoveryThe CBM Gas in Place with Recovery option calculates reserves for a coal bed methane field. Note that the Map Type option has no effect on these calculations, and the grid is always assumed to be an isopach grid. CBM Gas In Place: CBMGIP = Volume*Cf*Gc*Sg*Rf where Cf converts bulk density in g/cc to tons/acre-ft The Coal Gas In Place with Recovery calculation displays results in a variety of areas and formats. For area, the available units include raw units (as defined on the Units tab), square feet, square meters, and acreage. For volume, the calculation is limited to MMCF.
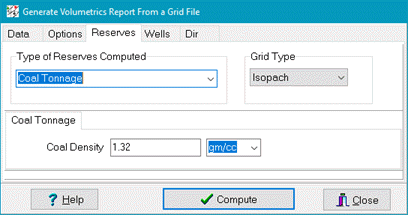
Coal TonnageCoal tonnage simply calculates the volumetrics of an isopach grid and multiplies this value by an average coal density. Coal (Tons) = Volume*CoalDensity*62.42796061/2000 when density is in gm/cc Coal (Tons) = Volume*CoalDensity/1000 when density is in kg/m3 The Coal Tonnage calculation displays results in a variety of areas and formats. For area, the available units include raw units (as defined on the Units tab), square feet, square meters, and acreage. For volume, the calculation is limited to Tons (2,000 lbs).
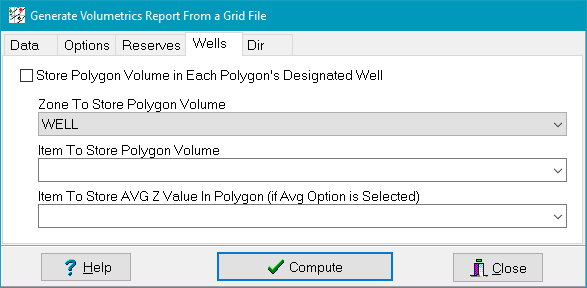
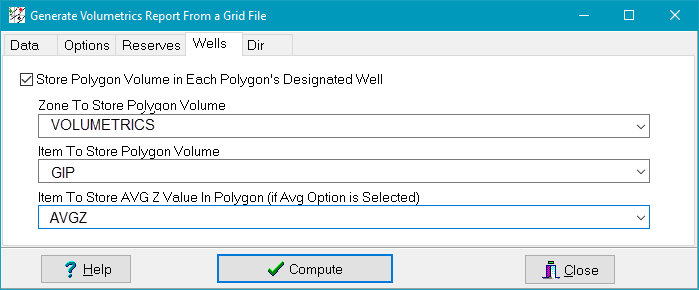
Wells tabPetra can copy the volumetric data for each named polygon to a specific well's designated zone and data item. Recall that each polygons designated well is established by double-clicking the polygon in the map module to open its Overlay Line Attributes screen (see Initial Polygon Setup above). The Store Polygon Volume in Each Polygon's Designated Well option stores the calculated volume to the designated well.
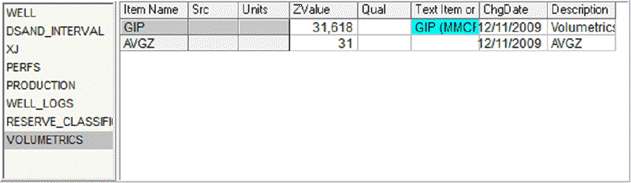
The Zone To Store Polygon Volume dropdown simply sets the zone where the relevant volumetric data will be stored. By default, volumetric data is saved in the WELL zone. In the example below, data will be stored in the VOLUMETRICS zone. The Item to Store Polygon Volume selects the specific data item where the relevant volume is stored. In the example below, data will be stored in the GIP zone The Item to Store AVG Z selects the specific pre-existing data item where the average grid thickness for each visible named polygon is stored. What this thickness actually represents depends on the type of the grid used Note that the Print Average Value for each Polygon in Report option on the Options tab needs to be selected for this option to work. In the example below, data will be stored in the GIP data item in the VOLUMETRICS zone.
Dir tabThis tab simply sets the directory of available grids. By default, this option is set to the project's GRIDS folder. |
 button. The
  button selects the most recently created grid in the directory.
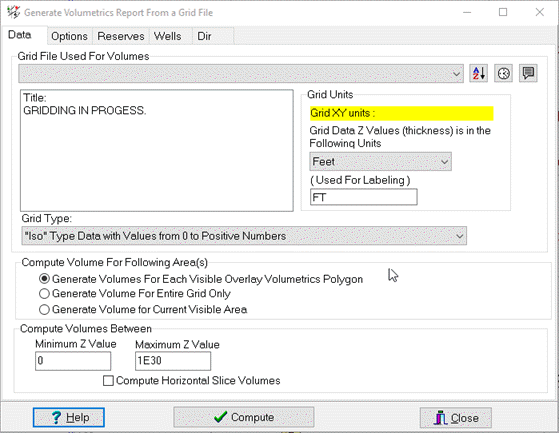

 for bth pressure and temperature to convert to imperial units. After the SI pressure and temperature are converted, then compute the volumetrics normally.