|
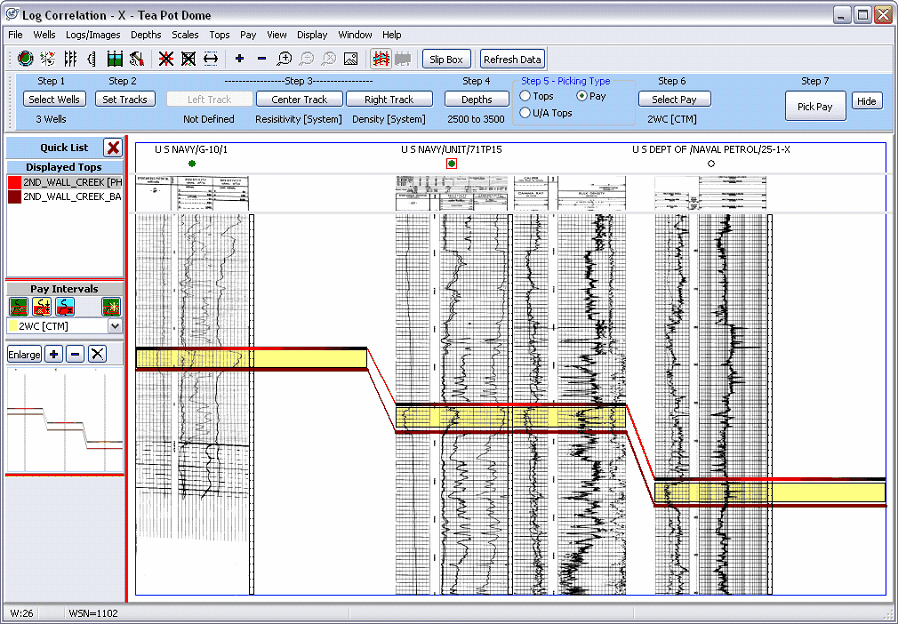
While in the Correlation Tool's main screen, dragging the lower line of the frame containing the well symbols increases and decreases this space. The  and and  buttons on the toolbar at the top of the screen toggle the well symbol and well data on and off, respectively. buttons on the toolbar at the top of the screen toggle the well symbol and well data on and off, respectively.

Plotting Log Scale Information
The tops of raster images usually have scale information for each track. If this scale information is calibrated, it can be shown on the Log Correlation Tool's main screen. To show and hide this raster scale information, click the  and and  buttons on the toolbar at the top of the screen. The next step is to tell Petra how the scale information is stored in the raster calibration. Under Logs/Images>Log Header Display on the menu bar at the top of the screen, select Header, Lower Scale, or Upper Scale. Many older Petra projects store scale information as the header. Once this data is displayed, dragging the lower line of the frame containing the scales stretches and squeezes the image scales for readability. buttons on the toolbar at the top of the screen. The next step is to tell Petra how the scale information is stored in the raster calibration. Under Logs/Images>Log Header Display on the menu bar at the top of the screen, select Header, Lower Scale, or Upper Scale. Many older Petra projects store scale information as the header. Once this data is displayed, dragging the lower line of the frame containing the scales stretches and squeezes the image scales for readability.
|