Log_Crossplot Polygons |
|
Facies polygons outline different areas of the crossplot. Each polygon in the Crossplot Module can have its own name, color, and facies value. A facies value is a way of coding a log crossplot polygon into a facies curve.
When creating a facies curve, Petra compares the footage of the relevant curves to the log crossplot polygons. The MD of data points falling inside a polygons boundary are given that polygons facies value. As such, facies polygons allow for a more nuanced cutoff criteria, since polygons vary the cutoff based on the relationship between logs. Additionally, multiple polygons means that a facies log can code for multiple facies at the same time.
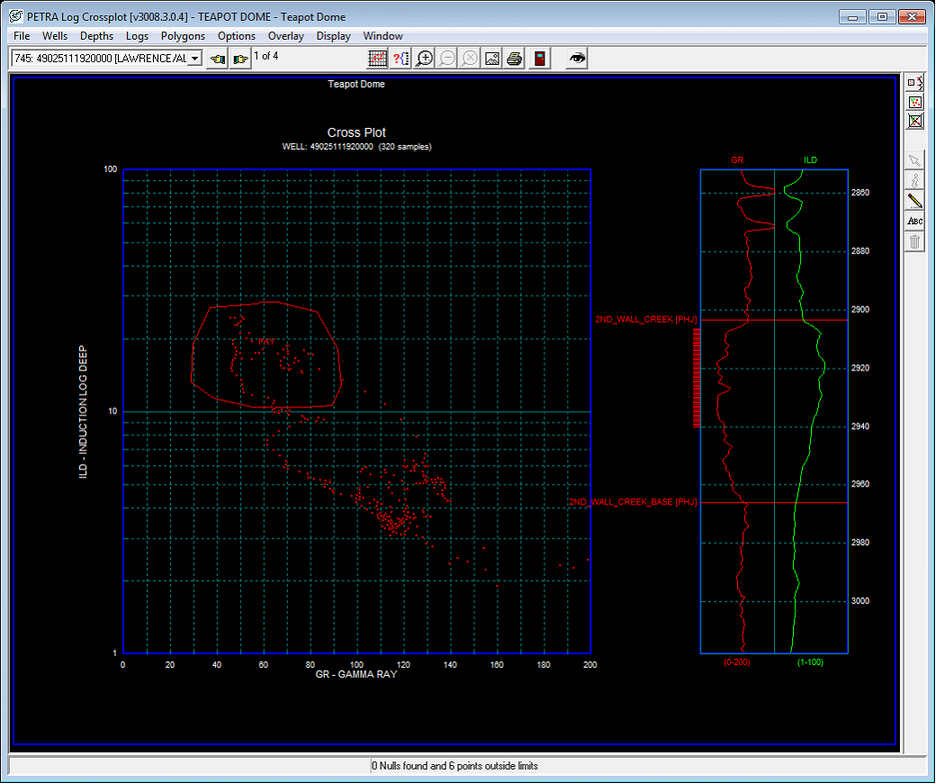
The example below shows a Gamma/Resistivity crossplot with a single pay polygon. This polygon covers the data points where gamma is lower than about 90 API units and resistivity is above 10 ohmm in short, its the potentially productive sand. Its facies value is 1. On the curves to the right, the data points inside this polygon are highlighted in red. Footage-wise, its from about 2905 to 2940 MD.
Carrying on the example, the polygon is converted to a facies log. All the data points inside the polygon are coded with the facies polygons value of 1. The example below shows how a facies curve actually looks in the Main Module; the depths where the gamma and deep resistivity curve values fall inside the polygon are coded with a facies value of 1. Thought this example only shows one well, a single facies polygon file can be applied to any number of wells, making it a powerful way of interpreting crossplots over an entire project.
Making a Facies PolygonTo establish a facies polygon, right click anywhere on the log plot and select Add Polygon. Alternatively, select Polygons>Add from the menu bar at the top of the screen. Drawing a polygon works exactly the same as drawing lines elsewhere in Petra. Pick polygon node points with the left mouse button and select the right mouse button to stop picking points. Petra will automatically close open polygons.
During picking, press ESC picking to cancel the current polygon or DELETE to drop the last picked point. Selecting F1 while picking will snap the cursor to the nearest node point on another polygon, which can be useful for generating polygons with no empty space between them and no overlap.
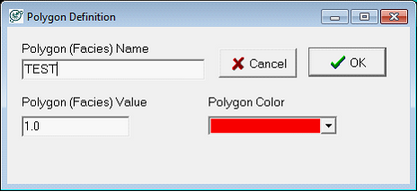
Once the polygon is picked, Petra brings up the Polygon Definition box. Here, simply enter the name of the polygon or facies, pick a color, and add a polygon facies value. The facies name is be the only way of distinguishing the polygons apart when calculating a facies curve, so spending time on descriptive names is a good idea. This facies value is the numerical code used when making facies curves, so make sure every facies has a unique value.
Modifying and Deleting a Facies PolygonTo change the area of a facies polygon, right click anywhere on the log plot, select Select Polygon, and then left click on the desired polygon. Make sure to click right on the line. Alternatively, select Polygons>Select from the menu bar at the top of the screen, and then left click on the desired polygon. This highlights the polygon and shows its node points; select a node point and drag it to the desired position to change the outline of the polygon. When finished, right click and select Redraw to refresh the screen and show the changes.
Changing a polygons name, color, and facies value is similar. Select the polygon with the mouse, as outlined above. Once the polygon is highlighted, right click and select Modify Polygon. Alternatively, select Polygons>Modify from the menu bar at the top of the screen with the polygon is highlighted. This opens the Polygon Definition box, which sets name, facies value, and color for the polygon.
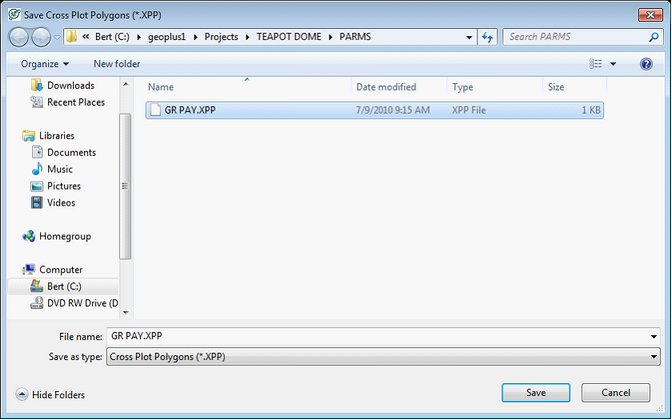
To delete a drawn polygon, select the polygon with the mouse as outlined above. Once the polygon is highlighted, right click and select Modify Polygon. Alternatively, select Polygons>Modify from the menu bar at the top of the screen with the polygon is highlighted. This opens the Polygon Definition box. Select the Delete Polygon button on the bottom of the box. Loading and Saving Facies PolygonsClosing the Log Crossplot Module erases the polygons from Petras memory, so make sure to save the polygons to a file. Additionally, this file will be used later to create facies curves. Select Polygons>Save from the menu bar at the top of the screen. Create a name and select the save button.
On the Save Polygons to Disk box, the area outside the polygons name and value can be modified. By default this area is named DEFAULT and its value is zero. This screen also allows for a comment to better describe the polygons.
Creating Facies Curves from Facies PolygonsTo compute a facies curve, select Compute>From Logs>Advanced Transforms from the menu bar at the top of the screen in the Main Module. This opens the Log Transformations module.
Setting the Wells and Depths in the Log Transformations BoxFirst, select the desired wells and depths in the Log Transformations Module with Wells>Select. Current Well From Main selects the single well currently selected in the Main Module. All Wells selects all wells available in the project. By Data Criteria selects wells based on a set of nested criteria including well headers, logs, or zone data. Wells From Main selects all wells currently selected in the Main Module.
Next, limit the calculation by depth ranges in the Log Transformations Module by selecting Depths>Depth Range on the menu bar at the top of the screen. The interval calculated can be constrained by zone definition, tops, or by a specified depth (MD or TVD) Using the Crossplot Facies Model to Calculate a Facies CurveNext, select the Facies Log button,
On the File tab, the Facies Polygon File entry box should be populated with the selected facies polygon file. The File Comments entered when saving will be shown below. To select a different facies polygon, select the Browse button.
The Logs tab sets the logs used in the facies curve calculation. To change the logs used in the crossplot calculation, select the desired curves on the X-Axis and Y-Axis dropdown boxes. Note that changing the logs will keep the polygon cutoff values the same. If using log aliases in the project, make sure to select the Use Log Aliases checkbox. This window also changes the name of the output facies curve; by default this is set to FACIES as in the example below. To change the name, just enter in a new curve name.
The Facies tab sets the actual values used in the facies curve. The Default Facies Value entry box sets the value of any foot where the curve data doesnt fall inside any of the polygons. In the example below, its set to 0.
The Log Values For Each Facies Polygon window lists each of the polygon names along with their respective facies values. The values shown are initially populated by each polygons facies value created in the Log Crossplot Module. To change a polygon, select the polygon name on the list, and change the value on the Edit Value box. Select the Change Value button to accept the changes. In the example below, depths where the gamma ray and deep resistivity fall into the PAY polygon will be coded as 1 on the facies curve, while all other depths will be set to zero.
The Discriminators tab filters data points by log criteria. To set a discriminator curve, select up to 5 curves and set the scale using the minimum and maximum entry boxes. Data points that fall outside of these data criteria are not included in the facies curve and will be given the default facies value entered on the Facies tab.
|