Changing Interval Attributes, Markers, and Patterns |
|
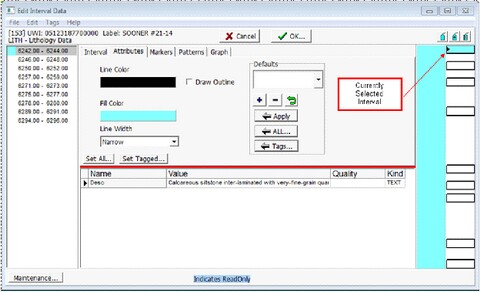
Every interval stores a set of colors, markers, and patterns that can be displayed on the cross-section module. Its possible to change these settings for every interval individually, or with multiple intervals at a time. Setting a Single Interval's Attributes, Markers, and PatternsFirst, select the desired interval by clicking on the graphical representation of the interval on the right side of the screen. The selected interval will be marked with a black triangle on the right side of the interval (highlighted in the example below). Next, select the Attributes tab. Here, select the interval's line and fill color. In the example below, the first interval (a calcareous siltstone inter-bedded with sandstone) will be drawn with a light blue fill. Notice that the selected color appears on the list of intervals on the far left as well as on the graphical representation of the intervals on the far right.
Next, select the Markers tab. Select the marker from the list of available markers, set the style and color, and select the Single - A single symbol is plotted Tiled - Multiple symbols are plotted like wallpaper. Column - Multiple symbols are stacked vertically in a column Row - Multiple symbols are aligned horizontally in a row Stretch X - A single symbol is plotted with its width stretched to fit the interval width Stretch Y - A single symbol is plotted with its height stretched to fit the interval height Stretch XY - A single symbol is plotted with its width and height stretched to fit the interval rectangle
Finally, select the Patterns tab. This sets a wide variety of lithologic patterns. Select one of the available patterns and a size from the list and select the
Setting Multiple Intervals Attributes, Markers, and Patterns in a Single WellFirst set a single interval to the desired attributes, markers, and patterns. Next, select the
The next step is to select the multiple intervals that will have this default attribute scheme. To select multiple intervals, select the Set tabs button: To tag all intervals in the well, select the
Finally, select the The
To add another default scheme, simply set a single interval to the desired colors, markers, and patterns and select the the
Even after adding default schemes, its easy to go back and modify individual intervals to display different information. In the previous example, three different default schemes reflected lithology and grainsize from core descriptions. To carry this example one step further, markers can also be added to signify porosity. Recall that for the sandstone/siltstone, an X marked low porosity. To add markers for an individual interval, select the interval and go to the Markers tab. Select the marker and the markers color, and select the
To save the changes to the database, select OK. Here, Petra gives the option to save or discard ALL changes made to the selected wells interval table. All the edits to all intervals will be ignored if you select CANCEL. Setting Multiple Intervals Attributes, Markers, and Patterns in Multiple WellsThe previous methods change the display of intervals for one well at a time. This can work well for a small number of intervals in a few wells. Even a modest Petra project can contain a large amount of intervals spread out over many wells; changing intervals one well at a time would be very tedious and time-consuming. Petras Find and Replace Interval Data can apply one of the Default attribute color and pattern schemes to all intervals in the selected wells that meet a set of search criteria. For more information see the Find/Change Data section. |
 button to post the marker symbol. In the example below, the X signifies a lack of porosity from the core description.
 button. Note that the size of the pattern governs the density of the patterns display. The example below shows the interbedded sands and shales from the core description.
 button on the Defaults section on the Attributes tab (highlighted below). This stores the current scheme of colors and patterns as a default attribute so it can be used later on different intervals.
 or hold down the CTRL key. Next, select the desired intervals on the graphical representation of the intervals on the right side of the screen. Note that the selected or tagged intervals have a small black triangle on the far right (highlighted in the example below). In the example below, all the very fine grained sandstones have been tagged.
 button. To drop all tags, select the
  button.
 button on the Defaults section of the Attribute tab. This applies the current Default scheme of colors, markers, and patterns to all tagged intervals.
  button only applies the default scheme to the currently selected interval, while the
  button applies the default scheme to all intervals in the well.
 button on the Defaults section on the Attributes tab. In the example below, there are three default schemes based on lithology: the blue interbedded siltstone/sandstone, the pale yellow very fine grained sandstone, and the bright yellow fine grained sandstone.
 button. In the example below, red stars have been added for all intervals with porosity above 10%, and a black X for all intervals with porosity below 10%.