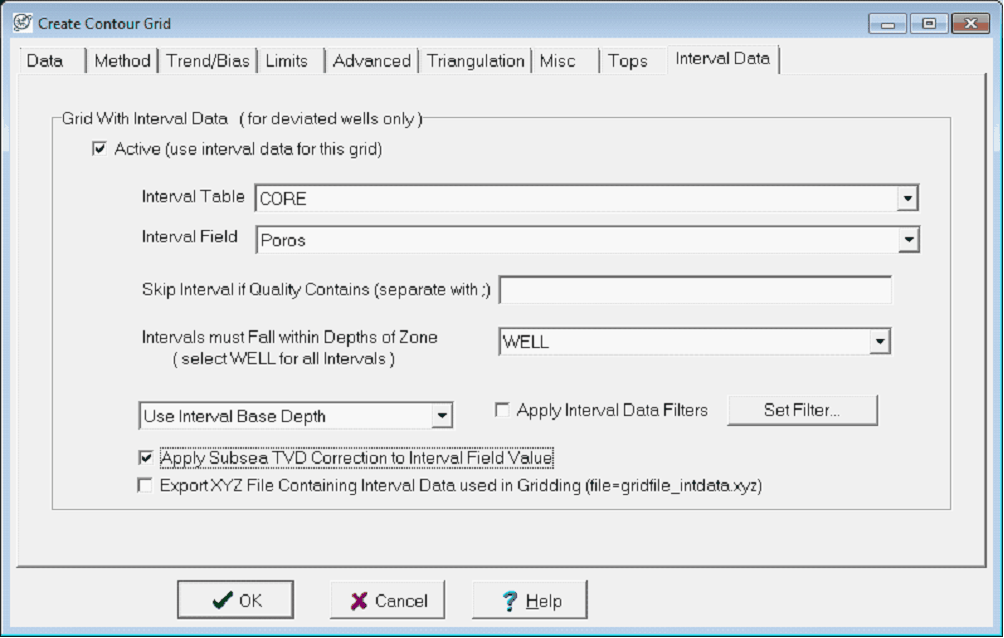
Interval data tab |
|
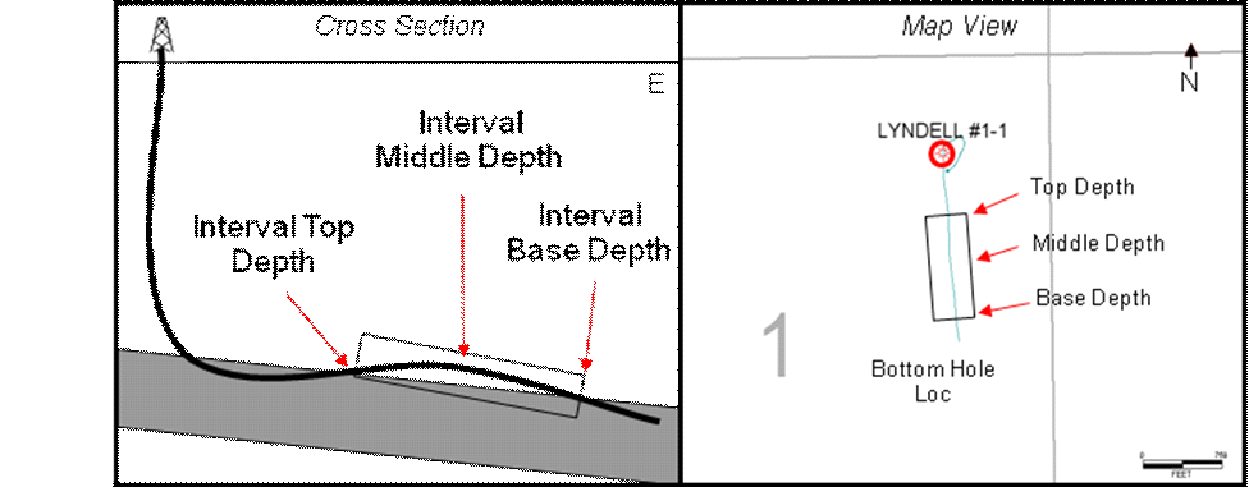
Deviated and horizontal wells can generate data spread along the wellbores path. Interval data is a good way of displaying and incorporating multiple data points along a wellpath into a grid. Petra can grid any numerical interval field designated as a real value. Date and text interval fields cant be used in gridding. In the Map Module select Contours>Create Grid from the menu bar at the top of the screen. Here, select the relevant data, grid size, and surface style; Petra can integrate interval data into a grid using zone data, tops, overlay contour lines, or other XYZ data. On the Interval Data tab, select the Active option to use the selected interval table and numerical interval field in gridding. Note that there are a couple of ways to modify which intervals are used in gridding: intervals can be pared down by quality codes, zones, or interval filters. The Skip Well if Quality Code Contains option allows the user to skip wells that have specified quality codes. Here, enter one or more values separated by a semicolon to indicate intervals that are NOT to be used for gridding. This Intervals must Fall within Depths of Zone option limits which intervals are used in gridding to only the intervals inside the specified zone definitions. The WELL zone covers all depths, and consequently all intervals. Be careful when using zones and horizontal wells. Note that this zone criteria works uses the zone interval definitions, which are often defined by tops. Horizontal wells that stay entirely within a zone and never reach the base will not have a base top picked, and will consequently be excluded from gridding. The Apply Interval data Filters option provides more direct control over which over which intervals are used in gridding. Intervals that do not meet the filter criteria are not gridded. To create or modify a set of filters, select the Set Filters button on the Filters tab.. For more information on filters see the Using Filters section of this document. The Use Interval Top/Middle/Base Depth is option sets where numerical real value interval fields are contoured. Especially with longer intervals in horizontal wells, this difference can significantly change where a data point is plotted. Note that this option is grayed out when gridding interval tops and bases. In the example below, a single interval in the wellbore is outlined in with a box on the cross section on the left. While the top and base of the interval have a specific XY location on the map, other data (such as an average porosity value) can grid that value at the XY position at top of the interval, at the middle of the interval, and at the base of the interval.
By default, Petra uses the surveys TVD when contouring the top and base of intervals. The Apply Subsea TVD Correction to Interval Field Value option instead corrects to SSTVD by subtracting the KB elevation. This option is essential when incorporating interval data into SS structure maps. The Export XYZ File Containing Int Data Used in Gridding option creates a text file containing the X and Y coordinates (using the projects map projection) along with the interval value used in gridding. Specifically, Petra creates a *.XYZ file in the projects GRIDS folder. This file will be named after output grid file name with a _INTDATA.XYZ suffix.
|