|
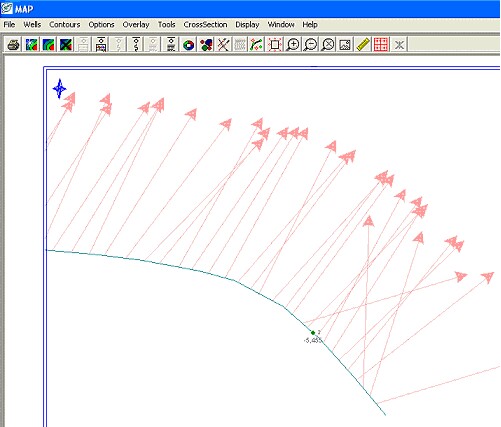
Arrows indicating direction and magnitude of dip can be plotted along the directional survey "worm" path.
To open this tool, select Options>Dip/Azm Arrows On Survey Path menu option.
This feature requires two digital log curves defining the dip magnitude (dip curve) and direction (azimuth curve). Curve values must be in degrees. Arrows are drawn at specified intervals along the survey path oriented in the direction defined by the azimuth curve. The length of the arrows are either all the same length or proportional to the dip curve values.
Curves - Choose the dip and azimuth curves. Set the "Use Log Curve Aliases" if the dip or azimuth curves have been aliased.
Arrows - Options are available to set the arrow line length and arrow head size. These sizes are specified in map xy coordinates, i.e., feet or meters. When the "Proportional" option is checked, the arrow line length represents the maximum arrow length, i.e., 90 degree dip. Values with dips less than 90 degrees will have arrows proportionally shorter than the maximum. For example, a dip of 30 degrees will have an arrow that is 1/3 as long as the specified length.
Dip Labels - Optionally, you can post the dip magnitude. The dip is posted at the end of the arrow head at a height specified in map xy units.
Depth Increment - Arrows are placed along the survey path at a specified interval. This interval is given in curve depth units. For example, an increment of 100 would place arrows at 100ft (mtr) measured depth intervals along the survey path.
No. of Samples to Average - This feature allows the arrows and dip labels to represent averages of several values. For example, given a depth increment of 100 and an average value of 100, then the arrows plotted at 100ft increments would be the average of 50 samples above and 50 samples below the depth being posted.

|