MLP: Regression
Analytics Explorer runs a regression operation in machine learning when the attribute being calculated is numeric. This algorithm calculates a selected metric based on specified inputs. In this example, the selected metric is the Gas EUR using the Zone table.
Remember to run Attribute Analysis before finalizing your input attribute selection. See Attribute Analysis for more information.
When the calculations are complete, Analytics Explorer opens on the Model Analysis tab. This tab has 3 charts: Prediction Correlation (Evaluation Data), Prediction Correlation (All Data), and Importance per Attribute.
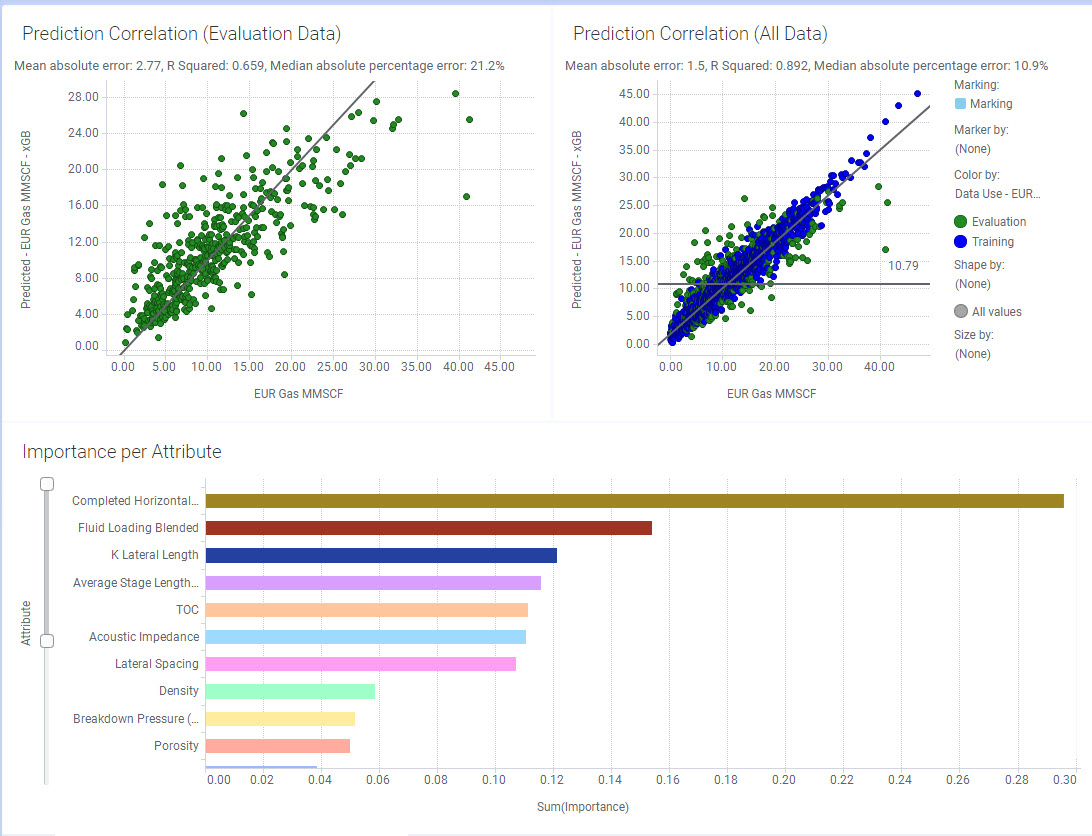
The Prediction Correlation shows the correlation between the actual data and the predicted data. The left plot uses just the evaluation data, and the right plot uses all the data.
By default we use 80% of the samples to train the model and 20% of the samples to test the models. However, in a non-linear progression problem, the prediction correlation may not be the best indicator. Therefore, the Mean Absolute Error (MAE) is displayed for the metric values displayed on the Y axis.
Both plots show a clear correlation. The goal is to minimize the mean absolute error (MAE).
Predicted Optimal Input Distributions
The idea behind the predicted optimal input distributions is that you select an output column that you wish to maximize (Crude output over a well’s first 12 months, for example). If you choose to perform the feature analysis, the algorithm gives you a numeric range (on the boxplot) and visual distributions for each important variable (defined as being inside the top 90% total importance). These distributions show the predicted values that will lead to the highest output values for the selected label column.
The numeric range is obviously useful at a glance, but the distributions help show how strong the relationship is. The tighter the distribution, the smaller the confidence interval, and the more sure that you can be that those values will produce high output values. If the distribution is very wide or is multi-modal, then the underlying relationship might not be as strong.