MLP: Classification
Classification models are run when calculating text attributes, or integer attributes. The machine learning predictions runs a classification model on the input data and returns a confusion matrix for the calculated attribute and a bar chart of the importance of each input attribute. The confusion matrix is a table that summarizes how successful the classification model is at predicting examples belonging to various classes.
Remember to run Attribute Analysis before finalizing your input attribute selection. See Attribute Analysis for more information.
In this example, the matrix compares the actual formation top with the predicted formation top derived from the input log data.
The selected data table has both log data and formation top data. The objective is to understand how well the formation tops are predicted from the log data. 5 logs were selected for the analysis. The only changes to the general Machine Learning Predictions workflow are in the Select Table & Attributes. The logic and operations of the remaining options do not change.
When the calculations are complete, Analytics Explorer opens on the Model Analysis tab. This tab has 3 charts: Confusion Matrix (Evaluation Data), Confusion Matrix (All Data) and Importance per Attribute.
In this example, the model used the input data to predict the formation tops based on 5 logs.

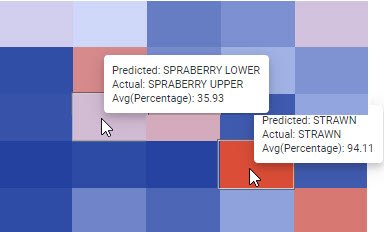
Hover over a square in the matrix to see the accuracy values:

In the matrix above, the model predicted the Spraberry Lower top when it was actually the Spraberry Upper top 35.93 % of the time. In contrast, It predicted the Strawn formation top correctly 94.11% of the time.
The importance of each log in the predictions is in the bottom plot, Importance by Attribute. The NPHI log was the most important log in the predictions followed by the GR log. This could be because of the number of boreholes that contain these logs, the quality of the log curves, or likely a combination of the two and other factors.