EDIN Reservoir Benchmarking
EDIN Reservoir Benchmarking provides the tools and data to compare your assets against those of similar complexity using a machine learning algorithm we developed to create a model on global reservoir data.
The assessment conducted with EDIN Reservoir Benchmarking is based on comparing assets of similar complexity. A machine learning algorithm was trained on S&P Global reservoir data to understand the recovery factor of oil producing reservoirs. Factor Contribution Analysis was then applied to the model to help explain the impact of each variable on recovery. The final features used in predicting recovery were then used to create a complexity index which was assigned to each reservoir.
To access this feature you must have a license to EDIN data.
You can analyze a single reservoir by comparing to other reservoirs of similar complexity, or you can analyze multiple reservoirs to the same global content. Note that for multiple reservoir analysis, the table with the reservoir data must first be imported into your Spotfire session.
After you specify the required parameters (or begin with the defaults), click Analyze. Analytics Explorer will retrieve the global reservoir model and build the following visualizations on a single tab.
In each scatter plot, the red dots are the training data, and the blue dots, the test data. Click the links for a visualization and brief description of each.
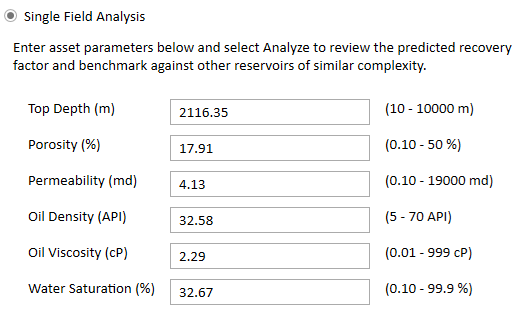
To run Single Field Analysis:
-
In Spotfire, select Analytics Explorer > S&P Global Content > EDIN Reservoir Benchmarking
-
Select Single Field Analysis.
-
Enter the property values. The default values are based on global attribute averages:
-
Click Analyze. Analytics Explorer will generate the visualizations and display in a single tab: Oil RF vs. RCI - Single Reservoir Analysis.
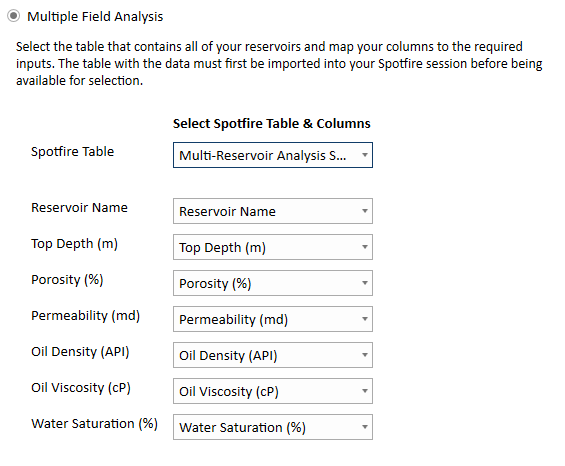
To run Multiple Field Analysis:
-
Open the reservoir file in TIBCO Spotrfire.
-
In Spotfire, select Analytics Explorer > S&P Global Content > EDIN Reservoir Benchmarking
-
Select Multiple Field Analysis.
-
For Spotfire Table, select the reservoir table you just opened with Spotfire.
-
Now match the reservoir table columns to the attributes. Analytics Explorer will do its best to match the columns based on column name. However, you may have to manually match the columns if the names are not clear.
-
Click Analyze. Analytics Explorer will generate the visualizations and display in a single tab: Oil RF vs. RCI - Multiple Reservoir Analysis.