Histogram data definition |
Top Previous Next |
|
The Histogram Data Definition tool sets the basics of the log histogram, including the log curve used, the limits and shape of the histogram, and the depth interval. Log Curve tabThe Log Curve tab sets the histogram title, curve, and axis.
Title - This entry sets the histogram title. This title will appear with the currently selected well information immediately above the histogram. Log Curve - This log dropdown sets the curve used in the histogram, as well as the upper and lower bounds. Log10 Scale - This option draws the histogram in a logarithmic scale instead of a linear scale. This can be useful for representing curves with a very large variation, such as resistivity curves. Use Log Alises - This option uses log curve aliasing to replace missing log curves with an equivalent log curve. Default Scale Range - This option sets the minimum and maximum log curve scales with the defaults set on the Main Module's Log Maintenance Tool. Statistical Scale Range - This option attempts to read the log curve values and set an appropriate scale. Reverse Curve Display - By default, Petra scales logs the log curve display from the minimum at the left to the maximum at the right. This option flips the log scaling such that the minimum is on the right, and the maximum on the left. Histogram tab
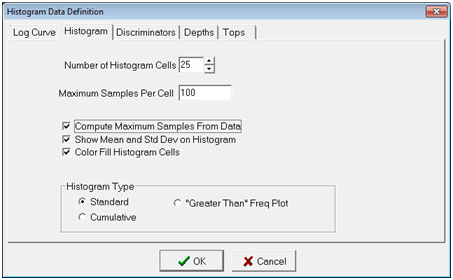
Number of Histogram Cells - This entry sets the total number of bins or "cells" used in the histogram. The best number of bins will vary from application to application. Maximum Samples Per Cell - This entry sets the maximum height of any one bin. The default is 100 Compute Maximum Samples From Data - This option instructs Petra to calculate and scale the vertical axis to the maximum number of samples in any one bin. When this option is deselected, Petra will scale the vertical axis to the "maximum samples per cell." Show Mean and Std Dev on Histogram - This option calculates and displays the mean and standard deviation for the histogram. The mean will appear as a long-dashed vertical line on the histogram, while the standard deviation will be two short dashed vertical lines. Color Fill Histogram Cells - This option fills the histogram bins. Deselecting this option will leave empty rectangles for the bins. Histogram TypeStandard - Standard plots divide the samples into different bins that each represent a discrete interval of values. The height of the rectangle represents the "frequency" or count of samples inside the bin. Cumulative - This type of plot divides the count for each bin by the total number of samples to create a percentage. Each bin then shows the sum of the previous bins up to 100%. "Greater Than" Freq Plot - This type of plot divides the count for each bin by the total number of samples to create a percentage. Each bin then shows the sum of the previous bins subtracted from 100%.
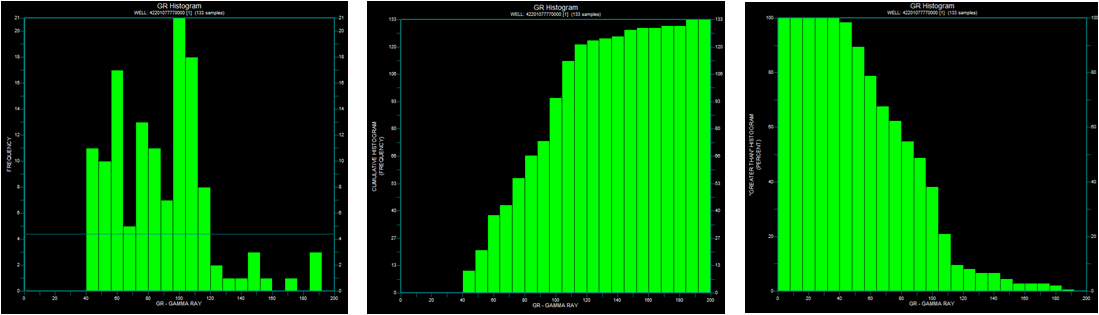
Standard (Left), Cumulative (Center), and "Greater Than" Freq Plot (Right) Histograms Discriminators tabThis tab establishes a discriminator curve to filter the sampled log curve. At depths where the discriminator curves are outside the minimum and maximum values, the corresponding depth will be left out of the histogram. If this box is checked and the log is absent, the statistics will not be calculated.
Depths tabBy default, Petra tries to display data over the entire log curve. Especially for log normalization, it's much better to keep the curve histogram limited only to the most relevent section.
Set Depths From Zones - This button sets the interval based on zone interval definitions. Select the desired zone from the "Select Zones(s)" list below. Note that the WELL zone by default covers -1M MD to +1M MD, so it should cover the entire footage of all wells. Set Depths From Range - This option sets the depth range from any two formation tops, measured depths, or true vertical depths. This button opens the Set Depth Range dialog.
To set depths by tops or by a specific depth range, select the button. Next, select the Set Range button. In the Set Depth Range box, select the relevant top, MD, or TVD button. For MD and TVD, select the relevant button and enter the adjacent depth in the entry field. For tops, select the desired top from the Fm Top Name dropdown box. Notice that an offset can also be added or subtracted to the fm top; this offset will include data points above or below the actual fm top depth. To set depths by a zones interval definition, select the desired zone on the Set Upper and Lower Depths From Zone dropdown menu.
Sample Decimation - This option decimates the data to only keep every Nth sample in the histogram. Setting this value to 2, for instance, would only display every other sample. Setting this value to 5 would only load every 5th sample. By default, this option is set at 1 to include every sample in the histogram. Tops tabThe Tops tab draws formation tops on the log curve on the right part of the Histogram Module. Tops can be particularly useful for orienting yourself to the log curve.
Display Tops on Logs - This option enables and disables formation tops on the log curve. Deselecting this option will keep the selected formation tops. To select the tops that appear on the log curve, add tops to the "Selected Zone Items" list by selecting th e">" button to add a selected top, or the ">>" button to add all tops. To drop a top from the "Selected Zone Items" list, select the desired top and select the "<" button. To drop all tops from the "Selected Zone Items" list, select the "<<" button. |