|
Picks are database-stored curve values. Picks are most commonly used for log curve normalization, such as scaling all gamma ray values in a project to set sand and shale values. Commonly, picks are first created for the entire project from statistical measurements, and the histogram module is used to visually inspect and QC the pick relative to the actual curve.
When working with picks, its usually a good idea make sure the CrossHair Cursor option is on. When this option is selected, (Display>CrossHair Cursor on the menu bar at the top of the screen), Petra draws a vertical line on the correlation log that corresponds to the cursors location on the histogram. This can make it significantly easier to see the relationship between the histogram value and the log.
Displaying Existing Picks
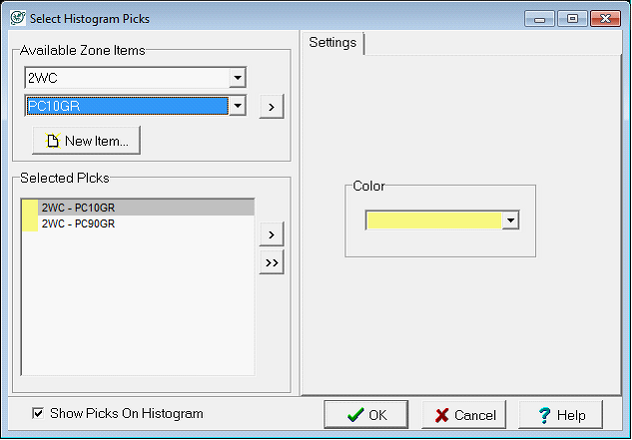
On the menu bar at the top of the screen, select Picks>Define Picks from the menu bar at the top of the screen. Alternatively, select the  button from the Picks toolbar at the top of the screen. This opens the Define Histogram Picks window. Here, select an existing zone data item with the zone (top) and data item (bottom) in the Available Zone Items box. button from the Picks toolbar at the top of the screen. This opens the Define Histogram Picks window. Here, select an existing zone data item with the zone (top) and data item (bottom) in the Available Zone Items box.
The example below shows two picks: PC10GR and PC90GR. Both of these picks these are log statistics created in the Main Module (Compute> From Logs>Statistics
), where PC10GR is the curves 10th percentile, and PC90GR is the curves 90th percentile.
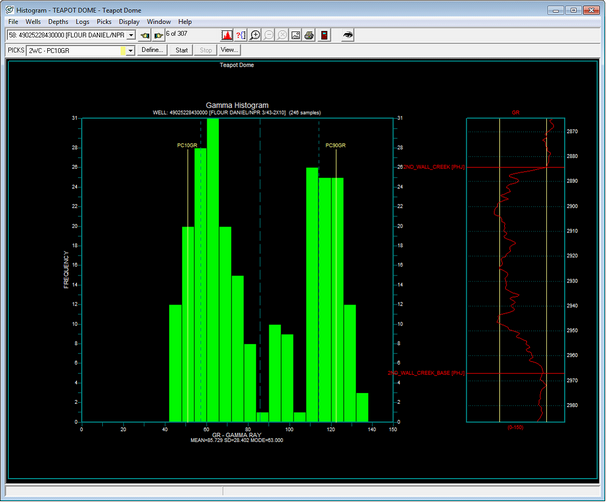
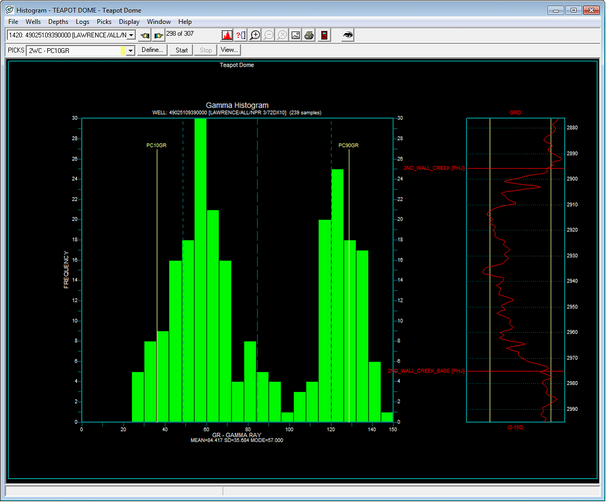
The picks for each well will then be displayed on the histogram. The examples below show two different wells. Since wells are logged with different tools at different times, the picks are slightly different. The well on the left has a smaller difference between the 10th percentile sand and the 90th percentile shales than the well on the left.
Creating New Picks
To create a new data item in the selected zone, select the  button in the Define Histogram Picks window. Select the button in the Define Histogram Picks window. Select the  button to add the data item to the Selected Picks list in the lower left corner of the window. Note that new zone data items wont have any data, so no picks will immediately appear. button to add the data item to the Selected Picks list in the lower left corner of the window. Note that new zone data items wont have any data, so no picks will immediately appear.
Modifying Picks
To modify a displayed pick, in the main Histogram Module window select the desired pick from the dropdown on the Picks toolbar, and select the Start button.

Select the new location of the pick on the histogram. As mentioned above, the CrossHair Cursor draws a vertical line on the log to show the histograms value relative to the curve. Left click to set the selected pick. Next, right click to open a set of options. These options include: Next Well, Prev Well, Redraw, End Picking, Delete Picking. Selecting Next Well and Prev Well saves the pick change and scrolls through the wells selected in the Histogram module. Redraw saves the pick change, refreshes the screen to reflect the changes, and leaves the pick tool active. End Picking saves the pick change and deactivates the picking tool, but does not refresh the screen. Delete Pick erases the pick value entirely, leaving a null value in the database for that well.
|