Log Crossplot Data Depths tab |
Top Previous Next |
|
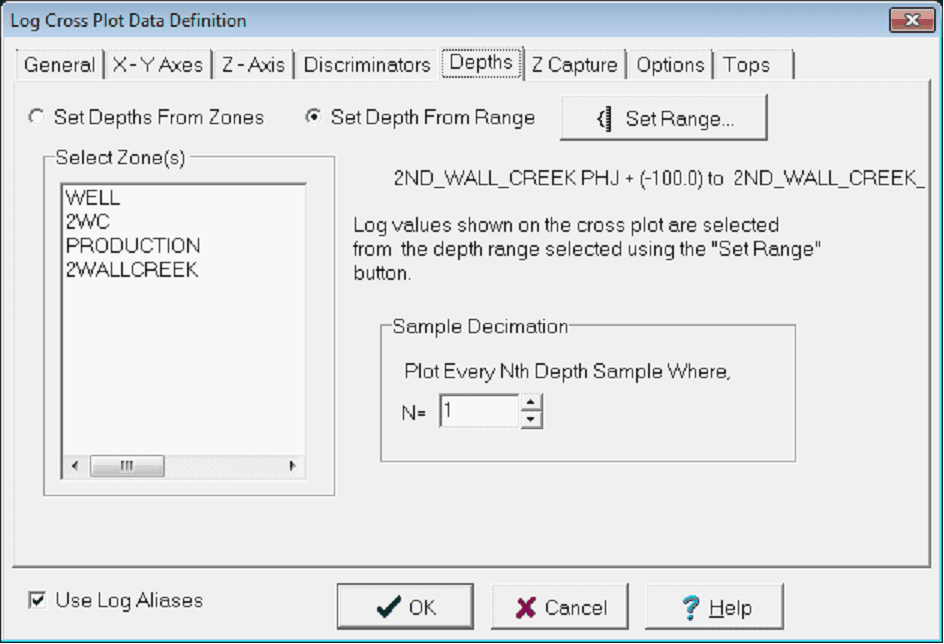
The Depths tab sets the depths of the data points for the cross plot. This is most useful for limiting the cross plot to a specific interval of interest. Data points can be constrained by zone definition, tops, or by a specified depth (MD or TVD).
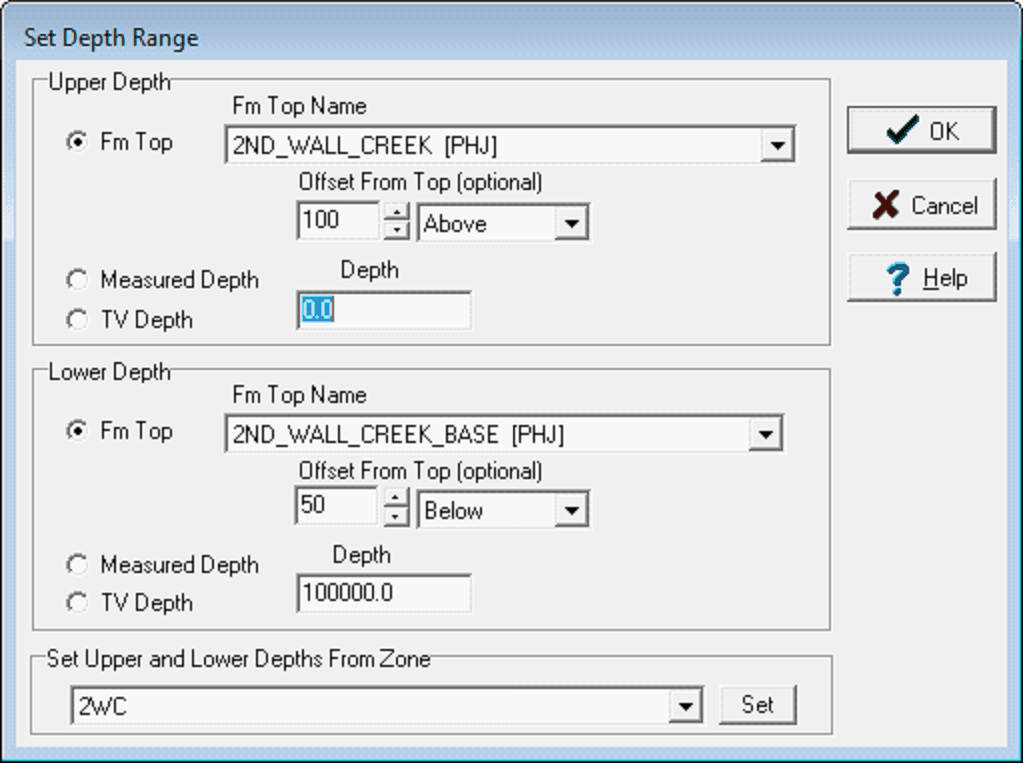
ZonesTo set depths by zone, select the Set Depths From Zones button. Next, select the desired zone. Petra will use the zone interval definitions established in the Main Module. Note that the WELL zone by default covers -1M MD to +1M MD, so it should cover the entire footage of all wells. If the tops used in the zone interval definition are missing for a well, Petra will not display the log plot. Set Depth From RangeTo set depths by tops or by a specific depth range, select the Set Depth From Range button. Next, select the Set Range button. In the Set Depth Range box, select the relevant top, MD, or TV Depth button. For MD and TVD, select the relevant button and enter the adjacent depth in the entry field. For tops, select the desired top from the Fm Top Name dropdown box. Notice that an offset can also be added or subtracted to the fm top; this offset will include data points above or below the actual fm top depth. In the example below, data points up to 100 feet above the 2ND_WALL_CREEK top and 50 feet below the 2ND_WALL_CREEK_BASE top will be included in the cross plot. Note that the Set Upper and Lower Depths From Zone will populate the depths fields on this screen with the selected zones interval definitions. This makes it easier to select an existing zones definitions and modify them.
Sample DecimationThis option decreases the total number of data points in the cross plot by only including every Nth valid data point. This can be useful when working with large intervals, or with finely sampled curves. As an example, setting N = 3 means that Petra will only include every third data point. To plot every available data point, select N = 1. |

