Log Crosspllot Data Ternary tab |
Top Previous Next |
|
The Ternary tab is only available when Ternary Diagram is selected on the General tab. This tab sets the curves and scales for the three logs on the plot. Note that if any of the curves are unavailable, Petra cannot plot the diagram. If using log aliasing, make sure to select Use Log Aliases on the bottom part of the tab.
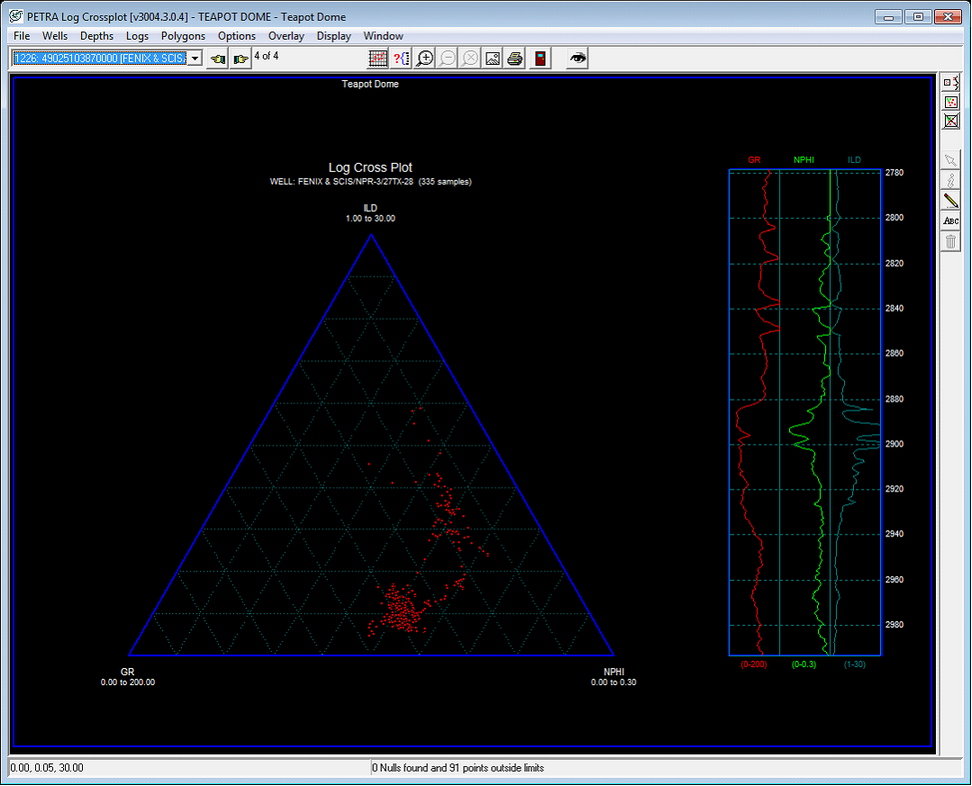
Axis 1, 2, and 3These sections set the curve and scale for the three axes on the triangle. Select the desired curve on the dropdown, and set the scale using the Minimum and Maximum. Note that curves can also be displayed in a logarithmic scale; just be sure to select a minimum above zero. The example below shows a ternary diagram between gamma, neutron porosity, and deep resistivity. The three curves used in the diagram are shown on the right side of the screen. Unlike a traditional phase diagram or lithologic percentage plot, the data points do not add up to a constant value. Instead, this plot represents how the petrologic data clusters together in different facies.
|