|
The raster log image calibration screen can also be used to digitize log curves and store them in the digital log database. Digitizing a curve involves using the mouse to trace over the curve on the image. Points are picked along the curve which identify each deflection of the curve values. You may start and stop the process as many times as necessary to digitize the interval of interest. Each start-stop or continue-stop sequence will generate a "curve segment". Curve segments may overlap and can be edited or deleted independent of other curve segments. These curve segments can be saved to a file as your "work-in-progress" and loaded at a later time to continue. Once the entire curve section has been digitized and edited to your satisfaction, they are stored in the project log curve database under a specified curve name. Existing database curves can either be replaced or appended with the newly digitized section.
IMPORTANT - Only one curve trace can be digitized at once. If you have several curve traces to digitize, then you'll need to digitize and store the first curve, "clear", then begin digitizing the second curve trace.
Before You Start!
1. You must open an image or previous calibration file.
2. The image must be depth calibrated over the interval to be digitized. Refer to the Depth Calibration section for details.
3. Activate the "Curve Digitizing Tool bar" option located under the View menu.
4. Click the Set Curve button to enter the log curve name and scale.
5. Define the track boundaries of the track containing the curve to be digitized.
6. Adjust the track boundaries to remove skew.
Setting the Curve Name and Scale

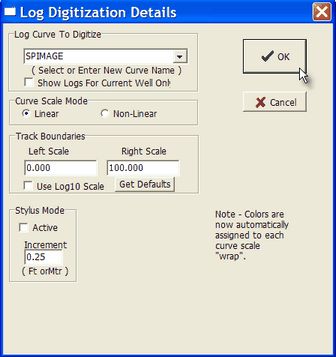

Digitizing Tool after setting a "linear" scale of 0 to 100.
Defining the Track Boundaries
The Digitizing Tool bar contains a "Track" section with a Left and Right button. To add the Left track boundary, click the Left button. Align the vertical cursor with the left edge of the track and click the left mouse button. Repeat the process using the Track Right button to define the right side of the log track.
Logs can only be digitized within the calibrated depth range.
Adjusting the Track Boundaries To Remove Skew
Many times, the edges of the log tracks are curved due to paper stretch or slippage while being scanned. The left and right track boundaries are identified with a series of control points located at the intersection of each calibration depth. You can, and should, move these control points to align the boundary segments with the image tracks. The control points can be moved using the left mouse button. Aligning the segments will remove skewing and result in more accurate digital curve values. Entire images can be straightened using the Straighten Image function.
Start Digitizing
Start by identifying the curve you wish to digitize by clicking the "Set Curve" button at the top of the digitizing tool bar. Select an existing curve or enter a new curve name. You must also specify the curve values for the left and right sides of the track boundary.
The Digitize Tool bar contains a section called "Digitize". To begin digitizing a section, click either the 'Start" or "Continue" button under the "digitize" tool, or click the "Manual" button under the "Auto" tool. If you click the "Start" button you will be prompted for the curve name and range information.
To digitize the curve section, position the cross-hair cursor at the uppermost depth on the curve trace to be digitized and click the left mouse button. Repeat by clicking at each significant deflection of the curve. IF YOU MAKE A MISTAKE, you can either STOP and edit the bad point(s), or continue and edit them later.
You can also use a continuous "stylus" mode option by activating the stylus mode in the curve definition screen. In the stylus mode, curve points are continuously recorded as you hold down the left mouse button and draw over the curve. You may temporarily activate the stylus mode by holding down the Alt key as you digitize.
Stop Digitizing
You can stop the digitizing process by clicking the right mouse button or by clicking on the "Stop" button on the Digitize Tool bar.
Auto Tracing
The section under "Auto" toolbar allows automatic digitizing of simple, bold, well-defined curves. You begin by clicking the "Start" button under the "Auto" section, then on the uppermost point on the curve to be digitized. The auto tracer will attempt to follow the densest portion of the log beginning at the selected point. You may press the ESC key or click the left mouse button to stop the auto tracer. The "Manual" button allows you to manually re-digitize over section not properly handled by the auto tracer. The "Set" button displays a screen for setting properties controlling the auto tracer.
Changing the Track Scales (Linear Curve Scale Wrapping)
Whenever the log image curve reaches a track edge, the scale will "wrap" and the curve will reappear on the opposite side of the track. At this point, you will need to STOP digitizing, change the scale, and then CONTINUE digitizing. The current left and right side track scale is displayed near the top of the Digitize Tool bar. Each curve scale range will be displayed in a different color beginning with red for the base scale. There are 6 colors defined above and below the base scale.
To increase the scale range, i.e., wrap the curve to the right, click on either the ">" button or on the right side scale value. To shift the scale to the left, click on either the "<" button or on the left side scale value.
The auto tracer will attempt to detect the track edge. It will stop the auto trace and request if you want it to automatically adjust the curve scale to account for the wrap.
Editing a Curve Segment
Selecting a Curve Segment -
Any of the digitized curve segments can be edited by first clicking the "Select" tool bar button and clicking on a curve segment or by simply double-clicking the curve segment. Selection is detected by a mouse click close to one of the control points make up the segment. The "selected" segment will be identified by small rectangles drawn at each control point of the curve. A right mouse click will deselect the curve segment.
Changing Curve Scale Range -
If you digitize a curve segment with the wrong scale range, select the segment, set the scale range at the top of the digitizing toolbar, then click the "Scale" button in the "Edit" section.
Moving Curve Segment Points -
Any of the selected curve segment points can be repositioned using the left mouse button. A right mouse click will deselect the curve segment to show the edited curve.
Deleting a Curve Segment -
Click on the "Delete" tool bar button in the Edit section to delete the selected curve segment. You can also simply press the Delete Key to delete the selected curve segment.
Breaking a Curve Segment -
You may break a segment into two segments. First, select the segment. Then, hold down the CTRL-key and click on a segment control point. All points ABOVE the picked point will become unselected. They are now part of a different segment.
Breaking and Deleting Part of a Segment -
You may break a segment into two segments then delete the bottom portion. First, select the segment. Then, hold down the CTRL and ALT-keys together and click on a segment control point. All points BELOW the picked point will be deleted.
Using the Delete Rectangle -
You can use a Delete Rectangle to delete intermediate points of the selected curve segment. To begin, select a curve segment. Hold down the SHIFT-key and click-and-drag the left mouse button to form a rectangle. All points within the depth range of the rectangle will be deleted. The segment will be de-selected and two new segments will be formed.
Deleting ALL Curve Segments -
Click on the "Clear" tool bar button in the Edit section to delete all curve segments that have been digitized.
Merging of Curve Segments -
Normally, when a curve segment is digitized over the same depth interval as a previous curve segment, the new segment is automatically merged into the earlier segment. Merging prevents having multiple segments over the same depth interval. Segments will not be merged when the auto-trace function is used or when the "wrap" settings are different. You can manually merge segments by first selecting a curve segment then press the F5 function key.
Saving Your Work-In-Progress
You can save the digitized curve segments to a file. If you think you may need to modify the curve segments at a later time, you should save them BEFORE you store your curve in the database.
Storing Your Curve In The Database
Storing the curve in the database makes a digital curve available for other function in Petra. When a curve is stored, the curve segments are resampled to the specified sample rate and merged together. When segments overlap in depth, earlier segments are replaced by later ones, i.e., the last segment you digitize overwrites the first segment you digitized (assuming there is overlap).
You may also load a digital log curve from the database using the "Load" button under the "Curve" section.
Starting Another Curve
If you want to digitize more than one curve, you will need to use the "Edit>Clear" button on the toolbar. This will remove previously digitized segments from memory so they don't get stored as part of the new curve.
Digitizing Non-Linear Scales
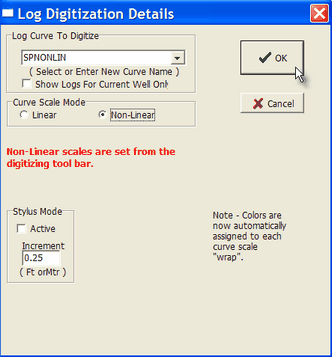
Example of Non-Linear Scale Details

Setting the Non-Linear Scale Points and Values
The non-linear scale is defined as a series of value-pixel pairs (max=100).
To begin picking the scale points, click the "Start" button (shown above). You will be prompted to begin the process.
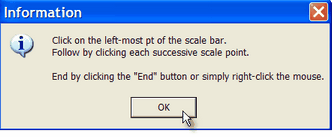
Click the left-most scale point of the scale bar and enter it's scale value.
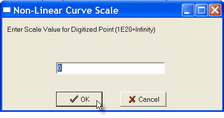
(If your scale uses a value of "infinity", enter a scale value of 1E20 or some other large number less than 1E30)
Proceed by clicking and entering values for each of the other scale points, working your way from left to right.
Terminate the process by clicking the "End" button or simply right-click the mouse. Petra will display each of the digitized scale values.
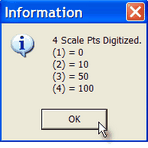
Note how the non-linear scale is displayed on the image and the left and right-most values are denoted on the toolbar.
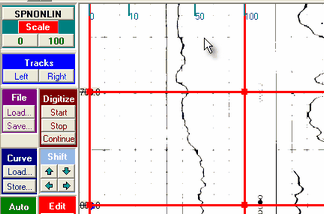
Proceed with curve digitizing as described above.
Warning - There is no scale "wrapping" with non-linear scales.
|