|
Click Here for a "How-To" guide on creating Contour Grids
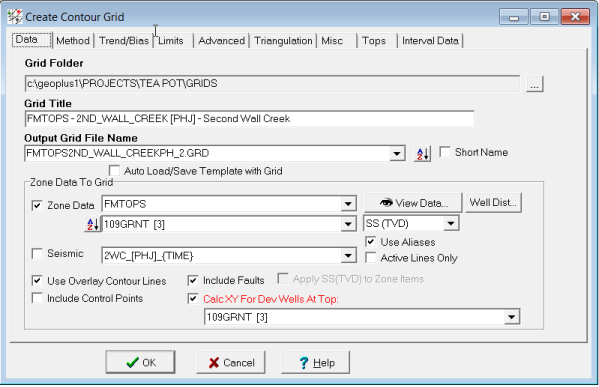
The Data tab selects the specific data that will be used, as well as the new grids name and location on a local computer or network.
|
Grid Folder
|
Show the currently selected grid folder, where any created grids will be stored. By default, Petra looks in the active projects GRIDS directory
Selecting the
button on the right opens the View Grid Attribute table described below.
|
|
Grid Title
|
This option sets the title for the grid. This title will be placed in the grid file header and displayed as the map title whenever a contour map is generated from the grid. A default title is created whenever well data items or seismic z values is selected.
|
|
Output Grid File Name
|
This is the external file name for the computed grid file. Petra creates a default file name when well data items or seismic z values are selected. The file extension for grid files is .GRD
|
|
Auto Load/Save Template with Grid
|
Saves selected parameters and options to grid template. This option must be selected for batch gridding (ON by default).
|
|
Zone Data
|
This option selects well data visible from the Zones tab on the Main Module. Simply select the zone and the appropriate zone data item. The FMTOPS zone includes all created fm top data. The adjacent drop down selects whether the fm top will be gridded as a MD, SS, SSTVD (if directional surveys are loaded and enabled), or Seis Time (if velocity functions are loaded). A grid using this data will use well data from for every selected well on the Map Module. Wells that have been dropped from the map will not be used in the grid.
Disabled wells, on the other hand are still honored when gridding, even though they dont appear on the map. To disable a well, first select the well in the Map Module with the left mouse button. Then, right click and select Disable (Do Not Plot). If disabled wells contain bad data points, Petra will still try to grid using that data, which may result in bulls eyes or other anomalies.
|
|
View Data
|
Opens the View/Edit Zone Data tool.
|
|
Well Dist
|
This option calculates some basic statistics about well spacing, which can be particularly useful when establishing grid spacing. This tool will calculate distance statistics between all wells displayed on a map without discerning if they have data or not. In other words, if you have a large number of closely spaced wells but only a few of those wells have data, this well distribution box will give you an average distance that is too small.
|
|
Seismic
|
This option grids Z values stored in each shot point. This option only is available if 2D shot points are loaded into Petra. The "Active Lines Only" option restricts gridding to only use seismic lines currently set as active. Remember that Petra will attempt to grid all checked data types, which can lead to bizarre maps if formation tops (stored in the thousands of feet or meters) are gridded along with seismic (stored in only a few seconds). When gridding only seismic data, be sure to uncheck the Zone Data option.
|
|
Overlay Contour Lines
|
This option uses ALL VISIBLE overlay contour lines on the map module to influence the gridding. Overlay contour lines are a powerful way of adding human geological knowledge to an otherwise completely computer-driven process. When drawing a contour line in the Map Module, setting a the overlay lines Line Class to Contour Line reveals the Contour tab, where the contour lines value is set and can be edited.
|
|
Include Control Points
|
Control points are data points not tied to a particular well. Control can come from a wide variety of sources including seismic data, topographic surveys, or from legacy computer-generated grids.Control points can either be loaded into Petras internal memory (under the Contours>Control Pts>Load File... in the Map Module) or simply displayed from an external control point file (under the Contours>Control Pts>Display External Control Point Files... in the Map Module). Control points can also be created from scratch inside Petra (under the Contours>Control Pts>Add... in the Map Module).
|
|
Include Faults
|
This option uses ALL VISIBLE overlay fault lines on the map module to influence the gridding. Fault lines break the normal process of interpolation between different data points. When drawing a fault in the Map Module, setting a drawn overlay lines Line Class to Fault Trace reveals the Fault tab. The Fault tab sets the fault lines value strength (determining the amount of fault drag), and the display of any fault symbols.
|
|
Apply SS(TVD) to Zone Items
|
This option grids SS (for vertical wells) or SSTVD (for deviated wells with loaded and enabled survey data) formation tops instead of MD formation tops. In areas with any surface topography, this option is essential to generate accurate subsurface structure maps
|
|
Calc XY For Dev Wells At Top
|
This option forces the data point to be contoured at the map position of a specific formation top. By default, Petra plots and calculates grids based on the location of the well symbol. On deviated or horizontal wells, however, this can mean that the data value can be gridded thousands of feet away from where the value was actually measured. This can significantly change an interpretation especially if the lateral part of the well is long or if there is faulting involved. Select the appropriate top from the drop down menu, Petra will calculate the map location of that fm top from survey data, and use that specific point instead of the well symbol location for gridding.
|
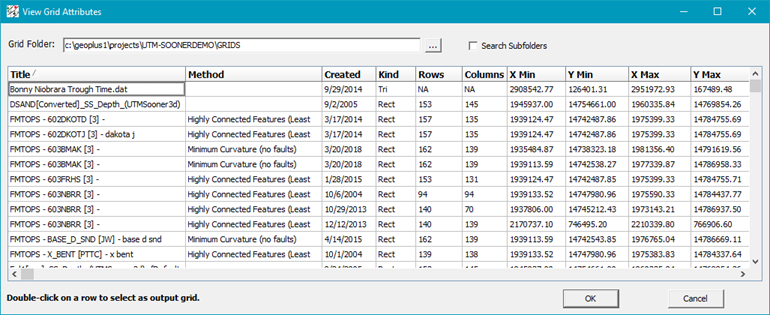
View Grid Attribute table
Provides a sortable table of the grid folder for managing the Grid folder and sub-folders. Clicking on a column header will sort the table accordingly.
Zone Data To Grid
Making a map often means using different kinds of data. When making a grid, Petra can use well data, external control points, seismic data, and drawn contour lines and faults. Petra can use any one or combination of these different data sets to create a single grid.
Since Petra will use all visible contours during gridding, its a good idea to keep different sets of contours separated into different overlay layers.
·Before gridding, make sure to only have the relevant contour lines visible. As an example, keeping structural contours (measured in negative thousands of feet) and net sand contours (measured in tens of positive feet) both active at the same time during gridding will result in bizarre maps as Petra will try to honor both sets of values.
·When using faults during gridding, make sure to only have the relevant fault traces for that particular surface visible.

|