|
The Plot Log Curves Beneath Wells tool controls how Petra displays log curves underneath well symbols on the Map Module.
To open the Plot Log Curves Beneath Wells Tool, select the
 button on the toolbar at the top of the Map Module, or select Options>Log Curve Map from the menu bar at the top of the Map Module. button on the toolbar at the top of the Map Module, or select Options>Log Curve Map from the menu bar at the top of the Map Module.
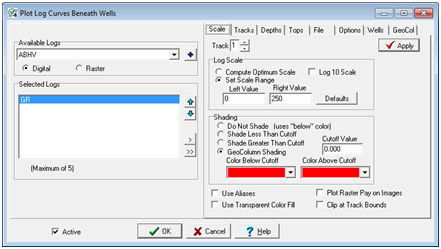
The Plot Log Curves Beneath Wells tool (left) and log curves on the Map Module (right)
Available Logs
This dropdown displays all the logs available in the project. Selecting the Digital or Raster button selects the general type of log.
To add a log to the Selected Logs list, select the desired log on the Available Logs list and left click the
 button. button.
Selected Logs
The Selected Logs determines which logs are displayed on the Map Module.
To drop a log from the Selected Logs list, select the desired log on the Selected Logs list and left click the "<" button. To drop all logs from the Selected Logs list, left click the "<<" button.
To change the log plot order, select the
 or or
 button. Logs at the top of the list are plotted first (and below) logs at the bottom of the list. button. Logs at the top of the list are plotted first (and below) logs at the bottom of the list.
Scale tab (Digital)
The Scale tab changes the display settings for the selected log curve on the Selected Logs list. Note that the Scale tab does not change appearance based on whether a digital or raster log is highlighted on the Selected Logs list.

The Plot Log Curves Beneath Wells Scale tab (Digital Log Selected)
Track - This entry sets the log's track, or relative position against the well symbol. In the screenshot above, the GR curve is set to track 1, which is immediately to the left of the well symbol.

Track positions relative to the well symbol (above the "DEPTH" track)
Log Scale
Compute Optimum Scale - This option dynamically computes the scale range at each well so that the log fills the track regardless of the data range. This option normalizes the scale so that all wells have the same appearance. Since this option changes the scale for every well, it can be misleading for quantitative analysis of well data.
Set Scale Range - This option sets a fixed left and right scale for the log curve. The "Defaults" button calculates a scale range that is 2 standard deviations around the mean using the first 20 wells with data.
Log 10 Scale - This option plots the curve on a logarithmic plot. Log scale values must be greater than zero and are normally entered as powers of 10.
Shading
This section sets how Petra draws the log curve.
Do Not Shade - This option just plots the plain curve without any shading or fills.
Shade Less Than Cutoff - This option fills the log curve when the log curve values are below the specified "Cutoff Value." Note that this option uses the "Color Below Cutoff" dropdown menu.
Shade Greater Than Cutoff - This option fills the log curve when the log curve values are above the specified "Cutoff Value." Note that this option uses the "Color Above Cutoff" dropdown menu.
GeoColumn Shading - This option enables the geocolumn shading, which fills the space under the log curve based on a log curve's values. Selecting this option enables the GeoCol tab on the far right side of the Plot Log Curves Beneath Wells Tool. The GeoCol tab controls the specifics of how Petra uses geocolumn shading.
Use Aliases - This option uses log curve aliases when the the selected curve is absent. Disabling this option will force petra to only use the exact curve name.
Use Transparent Color Fill - By default, Petra uses an opaque color fill that can obscure other items on the map. This option instead uses a transparent color fill that can still display items below the log curve display.
Put Raster Pay on Images - This option plots the raster pay intervals on the log.
Clip at Track Bounds - This option clips log data beyond th
Scale tab (Raster)
The Scale tab changes the display settings for the selected raster log on the Selected Logs list. Note that the Scale tab changes appearance based on whether a digital or raster log is highlighted on the Selected Logs list.
The Plot Log Curves Beneath Wells Scale tab (Raster Log Selected)
Track - This entry sets the log's track, or relative position against the well symbol. In the screenshot above, the resistivity raster log is set to track 2, which is immediately to the right of the well symbol. Particularly for raster logs, it's often useful to put different group names in different tracks to prevent overprinting.
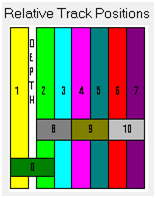
Track positions relative to the well symbol (above the "DEPTH" track)
Use Aliases - This option allows Petra to use raster group name aliases. Raster aliasing forms a list of "equivalent" raster group names - when the primary group name is missing, Petra attempts to substitute another group name instead.
Transparent Color Fill - By default, Petra uses an opaque color fill that can obscure other items on the map. This option instead uses a transparent color fill that can still display items below the log curve display.
Plot Raster Pay on Images - This option displays all raster pay intervals on the log.
Clip at Track Bounds - This option trims the raster group on the edge of the track. Since Petra automatically scales the raster image to the desired height and width, this option is really only useful for digital logs.
Tracks tab
The Tracks section applies to all logs plotted and contains options for setting the track width, height, and scale. The track dimensions define a rectangle in which each log is plotted.
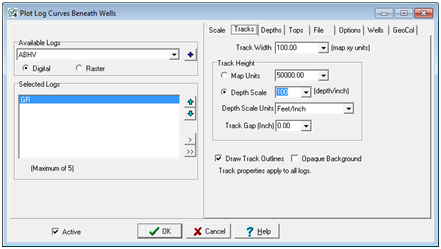
The Plot Log Curves Beneath Wells Tracks tab
Select or enter a "Track Width" value in units equivalent to the XY units or the map, i.e, feet or meters. The track width will be scale independent and will shrink or expand as the map scale changes.
Track Height
This option sets the height of an individual log curve.
Map Units - This option sets the height of the curve in the XY units on the Map Module. Since the height is in map units, the size of the curve will change proportionally by zooming in and out.
Depth Scale - This option sets the height of the curve in a set scale. For example, if the depth scale is 100 feet/inch, then 100 feet of log would occupy a space of 1 inch below the well spot. The size of the track does not change with the scale of the map; practically, this can lead to messy maps when fully zoomed out.
Depth Scale Units - This dropdown sets the scale units of the track.
Track Gap - This option adds additional space between the well symbol and the top of each track.
Draw Track Outlines option draws a rectangle at the track boundaries.
Opaque Background - This option draws an opaque background for all tracks. This makes the log curves easier to see, but can obscure other features on the map.
Depths tab
The Depths section shows the depth range over which the log curves will be displayed.
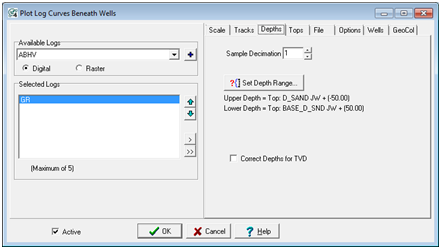
The Plot Log Curves Beneath Wells Depths tab
Sample Decimation - This option decimates the data to only export every Nth sample. Setting this value to 2, for instance, would only export every other data point. Setting this value to 5 would only export every 5th sample. By default, this option is set at 1 to export every datapoint in the curves.
Set Depth Range - In the Set Depth Range box, select the relevant top, MD, or TVD button. For MD and TVD, select the relevant button and enter the adjacent depth in the entry field. For tops, select the desired top from the Fm Top Name dropdown box. Notice that an offset can also be added or subtracted to the fm top; this offset will include data points above or below the actual fm top depth.
To set depths by a zones interval definitions, select the desired zone on the Set Upper and Lower Depths From Zone dropdown menu. Note that the WELL zone by default covers -1M MD to +1M MD, so it should cover the entire footage of all wells.
Tops tab
The Tops tab superimposes log curves tops on top of the displayed log curves.
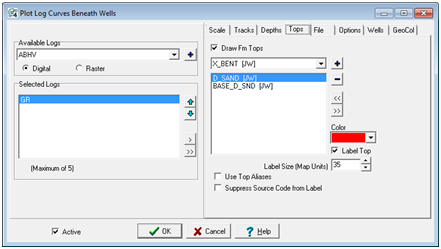
The Plot Log Curves Beneath Wells Tops tab
Draw Fm Tops - This option enables or disables the formation tops on the log curve plot. Disabling this option turns the tops off, but retains the settings.
Use Top Aliases - This option uses top aliases for the export. In practice, this option will attempt to replace the missing top with one of the other "equivalent" tops on the alias list.
Supress Source Code from Label - By default, Petra adds every formation top's source code. This option removes the source code, and only plots the name of the top on the label.
File tab
The File tab saves the current settings to an external file or restores settings from an external file.
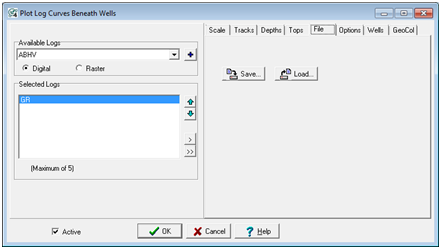
The Plot Log Curves Beneath Wells File tab
Save - This button saves the current settings to an external file.
Load - This button replaces the current log curve settings with the settings from an external file.
Options tab
The Options tab changes how Petra handles shifted logs.
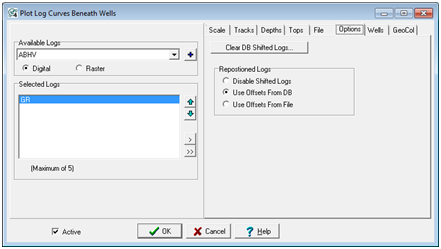
The Plot Log Curves Beneath Wells Options tab
Clear DB Shifted Logs - This option resets the curve shifting stored in the database. This will remove all log curve shifting for all wells in the database, which will affect all users.
Repositioned Logs
This section controls how Petra handles repositioned log curves.
Disable Shifted Logs - This option temporarily disables any log curve shifting. The project retains the settings.
Use Offsets From DB - This option uses the curve shifting normally saved in the database.
Use Offsets From File - This option uses log curve shifting stored to an external file. For more information on external offset files, see Data Offsets File Manager.
Wells tab
The Wells tab can limit the wells displaying logs to only those wells on a WSN list. Wells not on the list will not display log cuves.
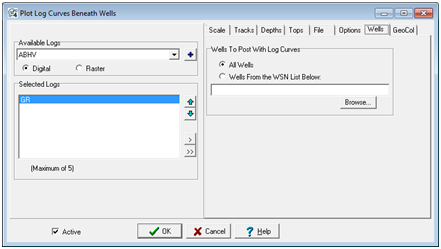
The Plot Log Curves Beneath Wells Wells tab
All Wells - This option allows log curves for all wells displayed on the Map Module.
Wells From the WSN List Below - This option only displays log curves for the wells on the user-selected WSN list selected below. Wells not on the WSN list will not display any curves.
GeoCol tab
The GeoColumn tab provides options for displaying a curve using "geocolumn" shading. The GeoColumn feature shades a curve with multiple colors based on curve values.
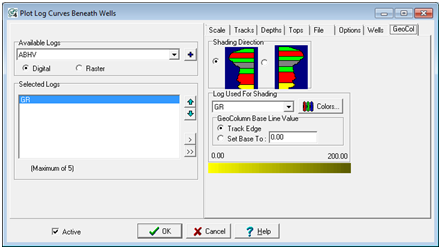
The Plot Log Curves Beneath Wells GeoCol tab
Shading Direction - This option sets the direction of the shading. The sading can be to the left or right of the log curve.
Log Used For Shading - The values from the curve selected here are used to define the color "cutoff" ranges. This curve can be the same curve as being shaded or can be any other curve.
GeoColumn Base Line Value - Shading occurs from the curve traces back to either the track edge or a specified curve value.
|