|
Dip Log
|
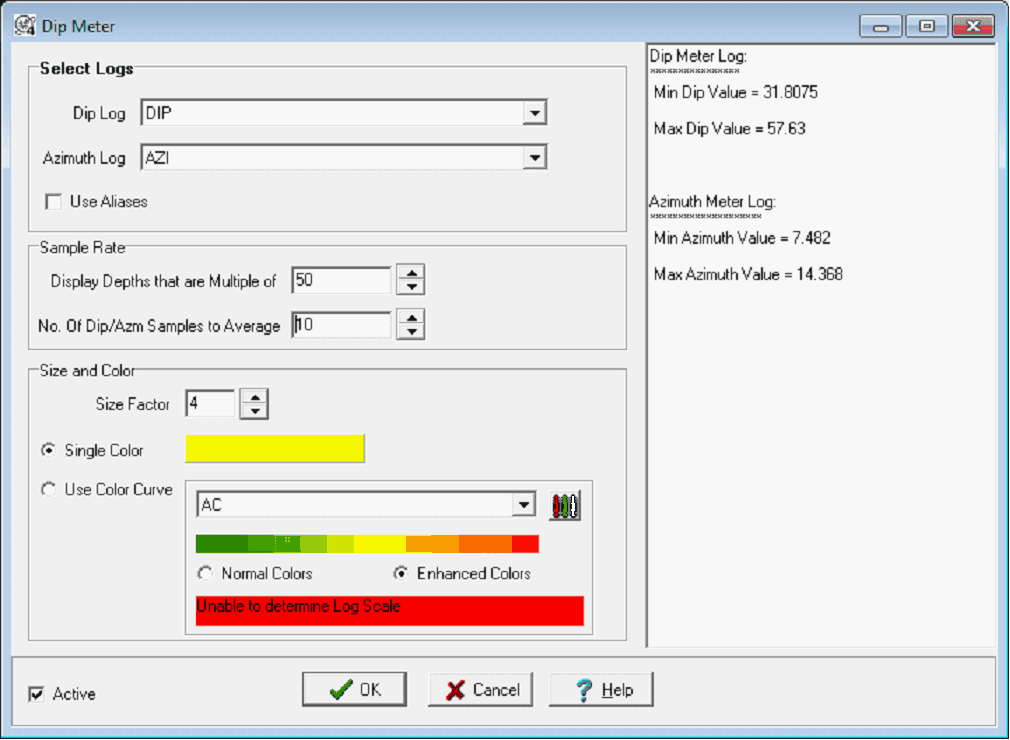
Selects the dip log in the project. Petra reads 0 as flat, and 90 as vertical.
|
|
Azimuth Log
|
Selects the azimuth log in the project.
|
|
Use Aliases
|
Enables log aliases for the dip and azimuth log.
|
|
Display Depths that are Multiple of
|
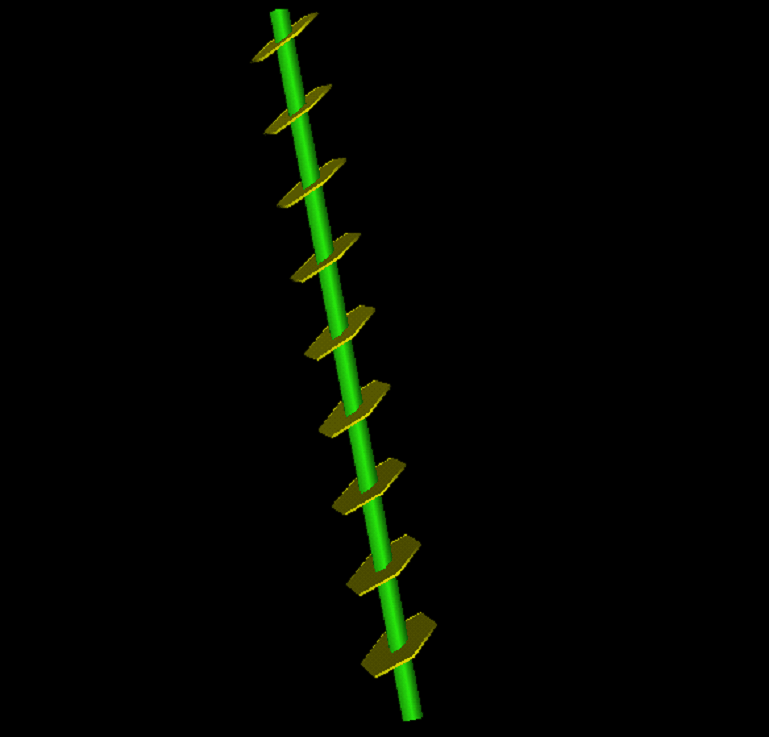
Restricts the discs to only a set depth interval. Setting this interval to to 50, for example, will only display dipmeter discs every 50'.
|
|
No. Of Dip/Azm Samples to Average
|
Calculates and displays an average of both dip and azimuth around every displayed disc. This can be useful for displaying data that represents a larger chunk of lithology. As an example, setting this entry to 10 will average 5 data points on either side of the displayed disc. This setting will generally depend on the data sample rate and the desired smoothing.
|
|
Size Factor
|
Sets the size of the dipmeter discs. The diameter is a multiple of the wellbore diameter. Setting this entry to 4, for example, will draw dipmeter discs that are 4 times bigger than the wellbores.
|
|
Coloring
|
The 3DViz Module can display dipmeter discs with either a single set color or with a Color bar set by another digital log.
|
|
Single Color
|
Displays dipmeter discs with a single set color. To change the color, select the  button. button.
|
|
Use Color Curve
|
Colors dipmeter discs based on another digital log curve value. Select the desired log curve from the dropdown - note that it can be any digital log curve, not just a dipmeter curve.
|
|

|
To set a Color bar, select the  button. This tool can use either the Normal Colors or Enhanced Colors. button. This tool can use either the Normal Colors or Enhanced Colors.
|
 button on the on the

 button.