Z-Cross Plot Module |
|
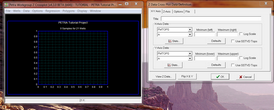
The Z Cross-Plot module graphically compares different Zone Data Items on an X-Y scatter plot to help identify the relationship between multiple variables. Color-coding the data points can show an additional third variable on the scatter plot. This module can be used to display petro-physical relationships, production information (when stored in a data item), or any other parameter stored in a zone. Launching the Z Cross Plot module brings up the Data Definition screen superimposed over the main Cross-Plot module, both of which are blank by default. To open the Log Cross-Plot module:·Main module: Tools>Z Data Cross-Plot · Click the Z data cross-plot Getting StartedAdvanced Tools |

 button on the