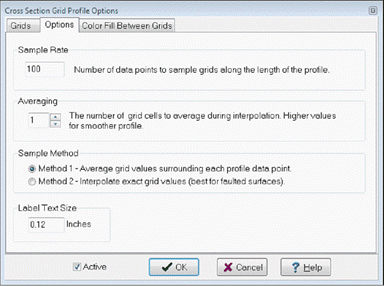
Posting Gridded Surfaces in the Profile View

 
DWM: Profile > Tops > Contour Grid Profiles

Petra can draw one or more gridded surfaces on the Directional Well Module'sProfile View.  You can create grids in the Map Module or with a simplified tool inside the Directional Well Module's Map View.  The Gridded Surfaces

embim171

Grids tab

Select Grids For Cross-Section Profiles

Contains a list of available grid files located in the project's GRIDS directory.

Selected Grids

Displays grids that have been selected to plot on the cross section.

  • Single clicking a grid name in this list will show the current attribute settings in the Grid Attribute section.
  • Double clicking a grid name will show the grid's statistics.

Grid Attributes

Sets each of the grid attributes for a selected grid.

  1. Highlight the grid name in the "Selected Grids" list
  2. Set the attributes and click the "Apply" button.
  • Grid Type - The grid type determines how Petra interprets the grid's Z values.  A grid must be identified as either:
    • Subsea (Structure)
    • Measured Depth
    • Datum

    Including a datum grid, such as a contour map of the KB, will insure that the other grids are correctly drawn when switching between log depths and tvdss depths.

  • Color - Line color for drawing the grid profile.
  • Line Style
  • Line Width.
  • Label - Enter the descriptive title for the grid. The default comes from the grid file header.

Options tab

Sample Rate

Determines how many samples are interpolated from the surface grid along the length of the cross section. The default value is 100.

Averaging

The averaging factor (N = 1..10) determines the distance around each profile data point in Method 1. Larger values result in smoother profiles. All grid node values within a distance of N times the grid spacing will be averaged using an inverse distance weighting function. A value of 1 will sample only the grid nodes within a single grid cell distance. A value of 10 allows all grid nodes that are closer than 10 times the grid size to be included in the average. For Method 2, the averaging factor determines the amount of smoothing applied by a triangular filter function.

Method

  • Method 1 samples the grid using an inverse distance weighting and results in a smoothed profile.
  • Method 2 interpolates each profile point from the grid cell it is contained in.
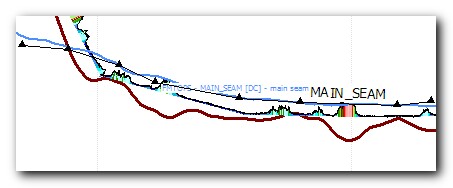
Label Text Size

Sets the size of the labels displayed on the Profile View.

Color Fill Between Grids

Tab is visible when two or more grids are displayed on the Profile View. It allows you to select a color between two grids displayed on the Profile View

To add a color fill:
  1. Select the "+" button to add a new line.  
  2. In the left column under "Grid 1" select the upper grid from the drop-down.
  3.  In the right column, under "Grid 2" select the lower grid from the drop-down.
  4. Select the desired color from the third column.