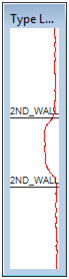
Type Log Curve Tool - Cross Section


The Type Log Curve Tool provides a floating, re-sizable window containing a single digital log curve. The tool is useful for correlating logs.

While similar to the Slip Box, there are a few differences:

  • The Type Log Curve Tool can only display a single digital log curve while the Slip Box can display an image of any combination of digital and raster logs.
  •  The Type Log Curve has a few additional display options relative to the Slip Log, including completely flipping the depth and log scales.
Creating a Type Log Curve Window:
  1. Select Logs > Select Log Curve menu to choose the actual log curve for the type log curve window.  There are limitations on the specific curve selected:
  • Only  log curves actively displayed on the cross section (set on the Log Display Options) can be used.
  • Only unaliased log curves can be used.

Agood workaround is to simply disable the "Use Alias Logs" option on the Log Display Option's Scale tab, create the window, and then re-enable the log aliases.  

  1. Select Logs > Start Picking From-To Pairs to define the depth range.  Left click once at the top of the interval and again at the base of the interval. Right click to stop picking.   If you pick multiple from-to pairs, Petra will only use the last pair to establish the depths on the Type Log Curve Window..
  2. Select Logs > Type Log Curve Tool > Set Type Curve menu.  The type curve will appear in a floating window.

The Type Log Curve Tool window can be dragged across the screen, as well as resized by clicking and dragging any of the edges of the window.

Type Log Curve Tool Options

There are a few additional options for the Type Log Curve Tool available by right clicking the window.

Match Depth Scale

Sets the height of the tool window so the log curve matches the current depth scale.

Match Curve Scale

Resets the width of the tool window so the log curve scale matches the current track width.

Match Depths and Curve Scale

Resets the vertical depth scale and horizontal log scale to match the current cross section depth scale and log curve scale.

Flip Scale

Reverses the amplitude scales. For example if the curve is plotted from 0 to 100, flipping the scale plots the curve from 100 to 0.

Flip Depths

Vertically flips the depths on the type log, so that the base of the from-to pair is at the top of the window.  This can be useful for working with structurally complex, overturned section.

Reload Curve

Reloads the curve from the database.  This can be useful for updating curves that have been normalized, merged, or otherwise changed.

Label Tops

Toggles labels on the flip box.

No Frame

Removes the frame around the Type Log Curve Tool.

Minimize

Minimizes the tool window.

Help

Displays this help screen.

Close

Closes the type log curve tool window.

Function Key Usage

Arrow Keys (unshifted)

Tool window is moved up, down, left and right.

Shift+Up Arrow

Tool window height decreased.

Shift+Down Arrow

Tool window height increased.

Shift+Left Arrow

Tool window width decreased.

Shift+Right Arrow

ool window width increased.