|
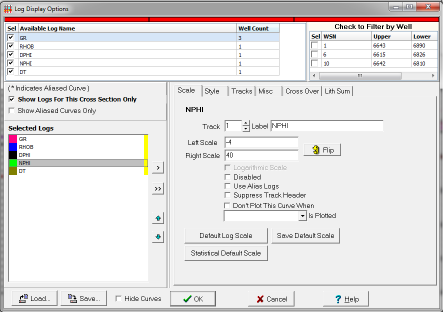
The Log Display Options dialog controls how log curves are displayed on the cross section. Options for defining the log scales include color and line style and shading criteria. For a detailed walk through on using these options on a variety of log curve types, see "How To Display Digital Log Curves."
To set the digital log display options:
- Click the Select Logs and Scales button
 on the Cross-Section toolbar on the Cross-Section toolbar
- Cross-Section Module: Logs > Scales and Display Options
. 
|
Indicator bar
|
Provides a visual reference of the wells (in order) that contain a highlighted log .
|
|
Log list
|
List the log names and well count contained in the current cross section.
|
|
Filter by Well
|
Option to display only the logs in a specific well of the cross section.
|
|
Selected Logs
|
List box of selected logs to display on the cross section. Additional controls on the side of the list allow for reordering the logs, removing a log from the list or clearing the list.
|
|
Selected Logs for ... Only
|
Lists only the logs for the currently selected wells on the cross section.
|
|
Show Aliased Curves Only
|
This option only shows curves that have been aliased. Using log aliases can greatly simplify the process of making a good template that will work for many wells.
|
|
Log option tabs
|
Scale, Style, GeoColumnTracks, Misc, Cross Over, Lith Sum
|
|
 on the Cross-Section toolbar