|
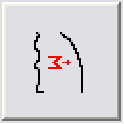
This transformation generates a curve in which each curve sample is the summation of all previous curve samples. This log transformation is available on the Advanced Transforms tool.
Standard Summed Curve
The Standard Summed Curve simply adds all preceding curve samples. This summation can start at the top and go down, or start at the bottom and go up.
Cumulative Probability Curve
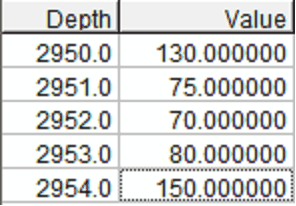
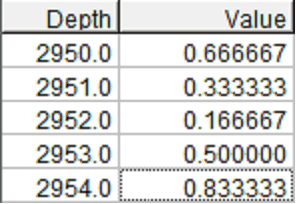
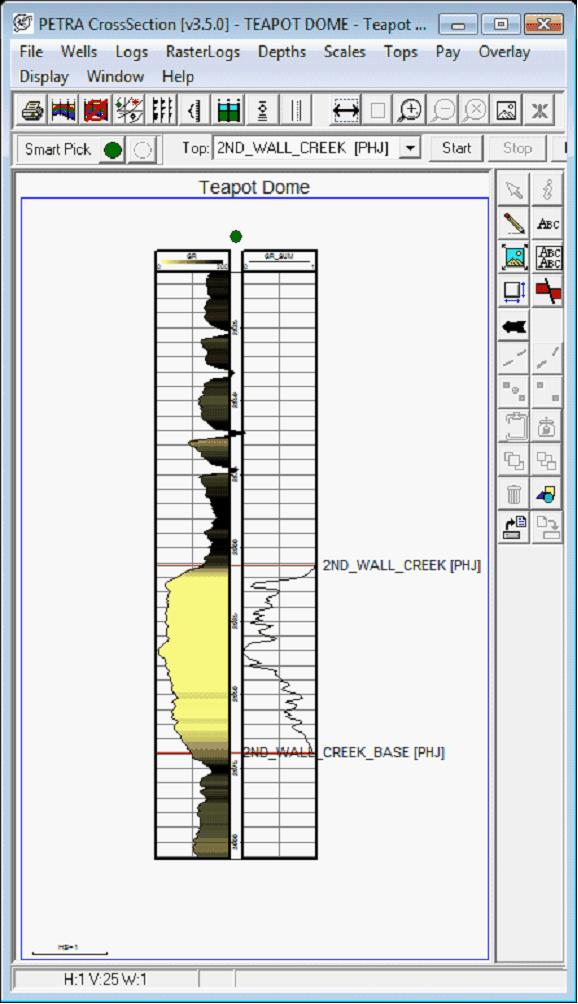
The Cumulative Probability Curve calculates the probability for every value on the curve that another point has a higher value. An as example, a depth with a cumulative probability of 0.10 means that the corresponding curve has a 10% chance that points will be greater than or equal to that value. In the examples below, the original depth vs. gamma ray curves is on the left, and the depth vs. cumulative probability curve is on the right.
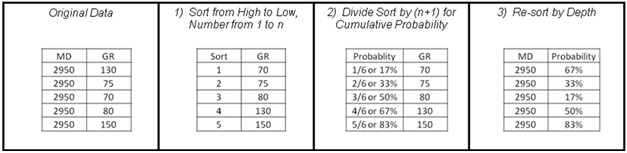
In more detail, Petra calculates the cumulative probability curve in three steps:
1. Sort the curve from low to high value. Assign a sort number to each value starting from 1.
2. Divide each points sort number by the total number of sort values (n) plus 1. In the example below
3. Re-sort the data by depth, storing the probability to the output curve
Cumulative Curve Type This option chooses between the Standard Summed Curve or the Cumulative Probability Curve.
Summation Direction - This option selects whether the summation will add values from top to bottom, or from bottom to top.
Apply Sample Rate to summed Values This option corrects for different sample rates in the logs. A well with a 0.5 sample rate will have twice as many values and twice the total summation as a well with a 1 sample rate. Put another way, this option multiplies the curve values by the curve sample rate during summation.
Log Curve To Convert This option selects the input log. Note that, unless the log is selected as the New Cumulative Curve, this log does not change in any way. In the example above, the GR curve is selected.
New Cumulative Curve This option selects the name of the newly created cumulative log.
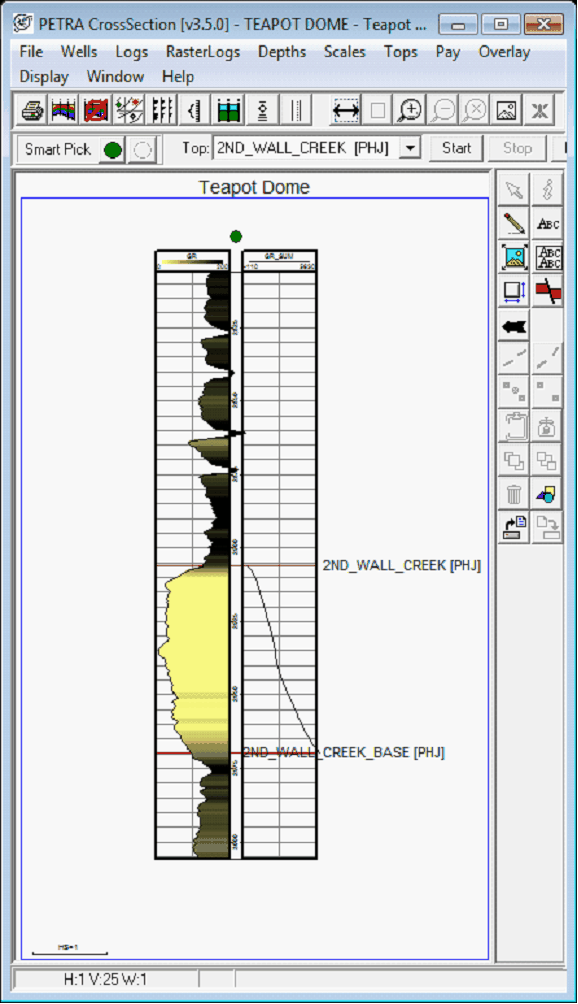
The example below on the left shows the original log next to the cumulative curve on the right. The scale for the cumulative curve ranges from -110 to 5630, reflecting the high sum of all gamma ray values. The example below on the right shows the original log next to the output cumulative probability curve. Note that the gamma curve is on a 0-200 scale, while the probability curve is on a 0-1 scale.
|