|
This transform resamples one or more log curves to use a specified sample rate. This is most commonly used to ensure all logs have the same sample size during log calculations or models. This function can also convert logs from feet to meters or vice versa. The Resample Logs tool has two tabs: the Curves tab and the Options tab. This log transformation is available on the Advanced Transforms tool.
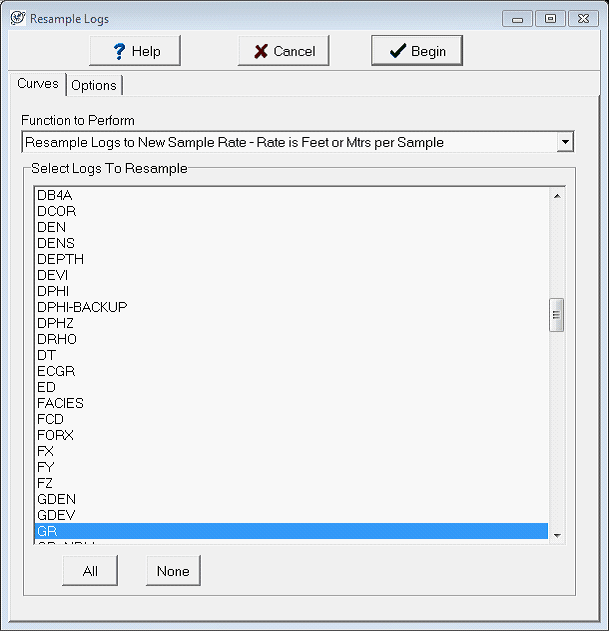
Curves tab
Function to Perform This dropdown selects the actual calculation for the selected log(s). There are five total options. In the example above, the Resample Logs to New Sample Rate (Rate is Samples Per Foot or Mtr) is selected.
Resample Logs to New Sample Rate (Rate is Feet or Mtrs per Sample) This option resamples logs based on the number of feet/meters per sample. As an example, 5 feet per sample results in one sample every 5 feet.
Resample Logs to New Sample Rate (Rate is Samples Per Foot or Mtr) - This option resamples logs based on the number of feet/meters per sample. As an example, 5 samples per foot results in a sample every 0.2 feet.
Convert Units Only (Do Not Resample) This option does not change the sample rate, but instead converts the MD values to use a different depth unit.
Set Units Flag (No Conversion, No Resample) This option does not change MD values or resample, but instead changes the log curves units flag.
Interpolate Nulls Only (Do Not Change Sample Rate) This option interpolates over gaps in the data, but does not resample the curve.
Select Logs To Resample This dropdown menu selects one or more log curves that will be resampled. The All button selects all logs in the project, while the None button deselects all logs. In the example above, the GR curve is selected.
Options tab
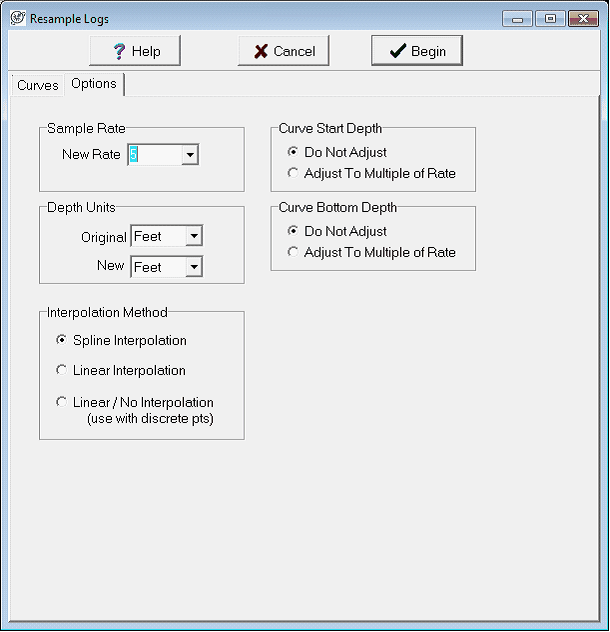
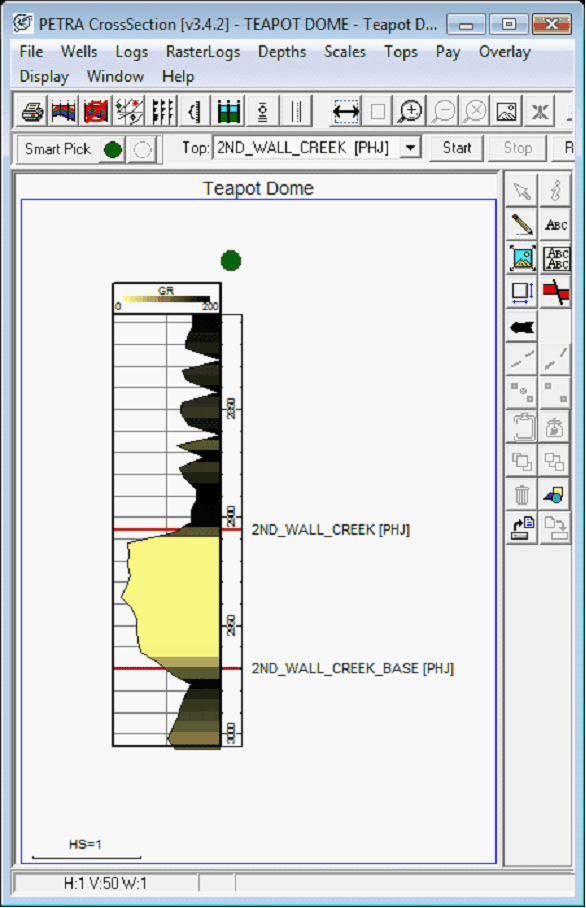
New Sample Rate This option selects the new sample rate, which can be 0.1, 0.2, 0.25, 0.5, 1.0, or 2.0. Note that what this number actually represents is controlled by the Function to Perform dropdown on the Curves tab. In the example above, the sample rate is set to 5, reflecting 5 feet per sample as set on the Curves tab. The example below shows how a decreased sample rate reduces the number of points on the gamma curve.
Depth Units These two dropdowns select the current depth unit of the log and the desired depth unit of the log.
Curve Start Depth - The Adjust to Multiple of Rate option adjusts the first depth of the curve to ensure that it is a multiple of the new sample rate. To leave the first depth alone, select Do Not Adjust.
Curve Bottom Depth The Adjust to Multiple of Rate option adjusts the last depth of the curve to ensure that it is a multiple of the new sample rate. To leave the last depth alone, select Do Not Adjust.
Method - This dropdown determines the specific algorithm used to resample the logs.
Spline Interpolation This method fits a curve to the data points and extrapolates the newly resampled data points from this curved line.
Linear Interpolation - This method fits a straight line between every two data points and extrapolates the newly resampled data points from this straight line.
Linear/No Interpolation - This method simply copies the last data point over the newly resampled data points, and does not actually reinterpolate through missing samples. This option works best on discrete data where there are single values separated by nulls such as core data.
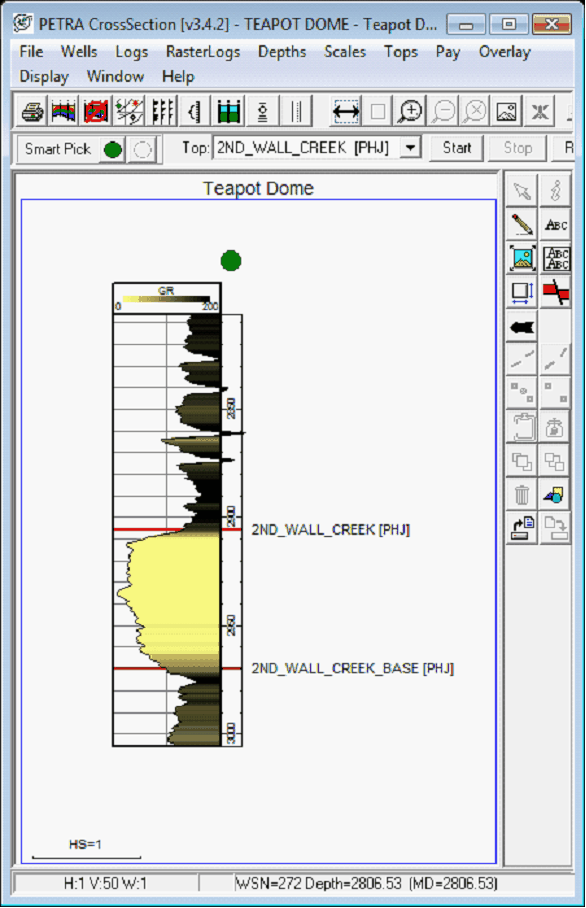
The example below shows the original curve on the left, and a greatly resampled curve on the right. Note that the resampled curve only has one sample every 5 feet, greatly degrading the information in the original curve.
|