Plotting Interval Data in the Map Module
Map: Options > Interval data on well path ...
Interval Postings
|
Interval Postings |
Creates and lists interval table data posted in boxes. Each posting is for one table, however tables can have multiple postings. |
|
Interval Posting tab |
Controls plotting of data for an interval table along the borehole. |
|
General tab |
Controls for general posting options |
|
File tab |
Saving and loading setting interval templates |
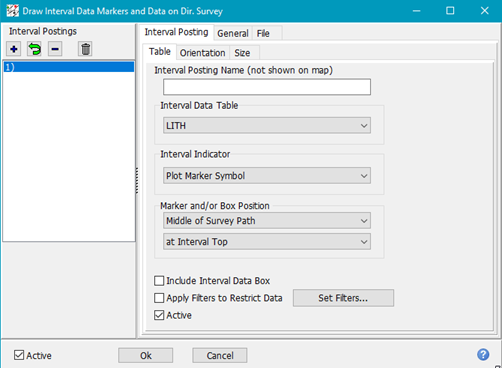
Interval Posting tab
|
Interval Posting name |
Label, used in the leftmost column for user reference only |
|
Interval Data Table |
The interval data table to be posted |
|
Interval Indicator |
Selects how the interval is rendered on the borehole
|
|
Marker and/or Box Position |
Provides interval box position options |
|
Include Interval Data Box |
Displays additional tabs for rendering data boxes:
|
|
Apply Filters to Restrict Data |
|
|
Active |
Enables rendering of current interval posting |
Include Interval data box
When selected additional tabs are displayed. These tabs allow you to define posting of individual interval data fields (for the same table) grouped together. Each interval posting can have its own data box.
Interval Posting – without “include interval data box” checked (default, compatible with previous versions)
|
Box Properties |
WSN List does not affect rendering of markers or rectangles. |
|
Box Data Items |
Selects the data fields in the interval data table to be displayed in box. Show Units – units are from the interval table column definitions. |