|
Introduction
Raster logs are scanned copies of paper logs saved as image files. In order to plot the correct part of the picture at the right depth on a cross section, Petra requires computer-recognizable depths to be assigned to depths printed on the original log. This process is called depth calibration. In the example below, a scanned resistivity log is depth calibrated (shown in red lines) at 2000' and 3000' MD.
For details on calibrating a raster log, see Raster Image Calibration
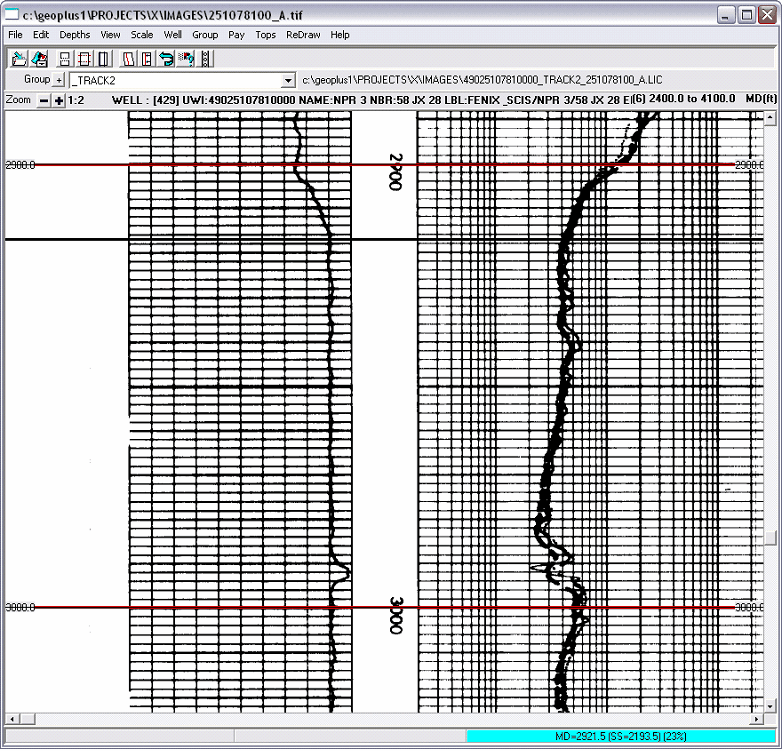
This guide assumes you're starting with a set of raster logs already scanned and depth registered, which is typical of commercial data vendors. For more information on calibrating your own logs from scanned images, see here.
Group Names
Raster images are assigned "group names", which typically are used to describe and group one type of log curve. In the example below, the "Resistivity" group (highlighted in red) contains resistivity curves and a correlation gamma ray curve.
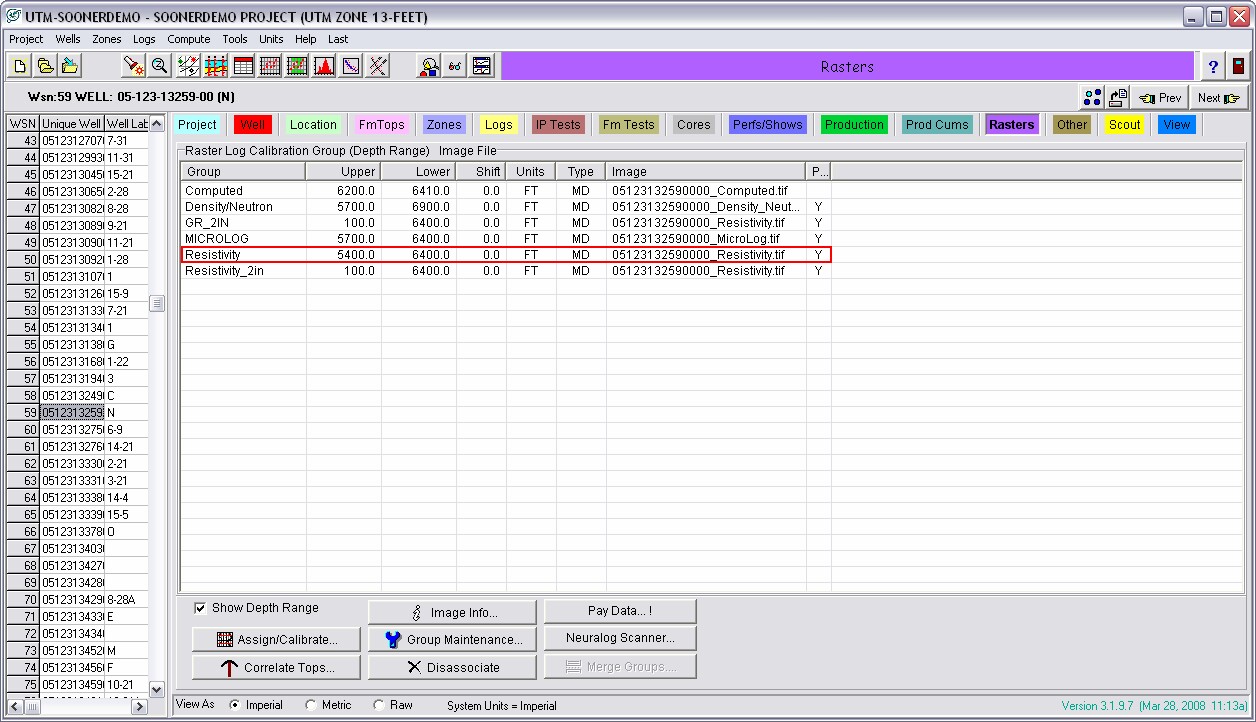
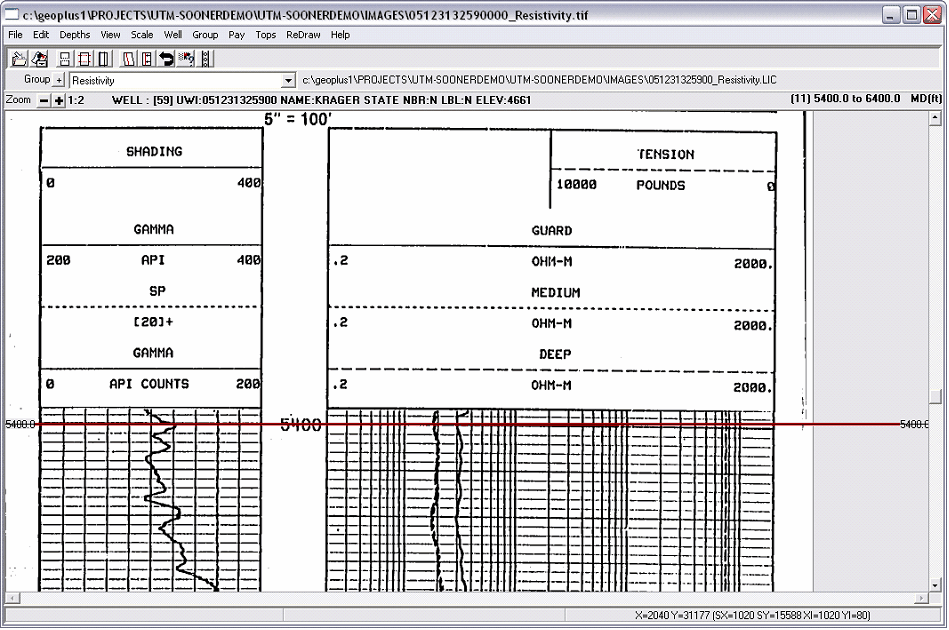
Double-clicking on the raster group name brings up the actual image. In the example, double-clicking the "Resistivity" group name brings up the resistivity log assigned to that group. Notice the red depth calibration line starting at 5400' MD.
Displaying Raster Logs on a Cross-Section
To display a set of raster logs, in the cross section module first go to RasterLogs>Log Images Display Options.
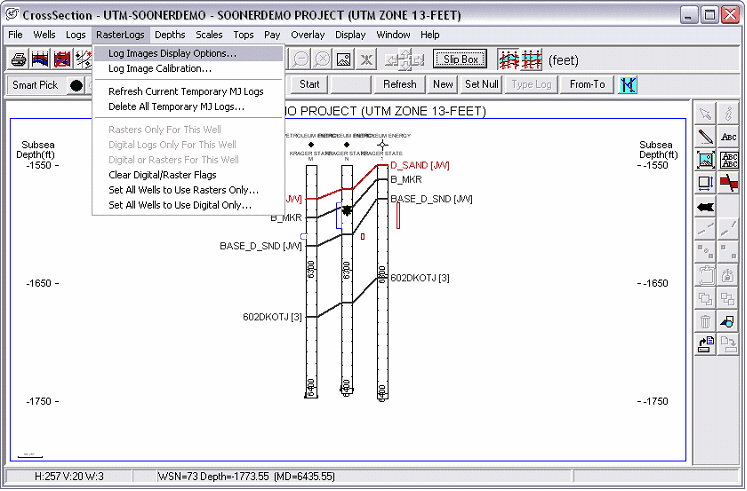
This brings up the "Select Log Images to Display" box. To display a raster image on the cross section, you need to select the groups for display and then place them inside tracks.
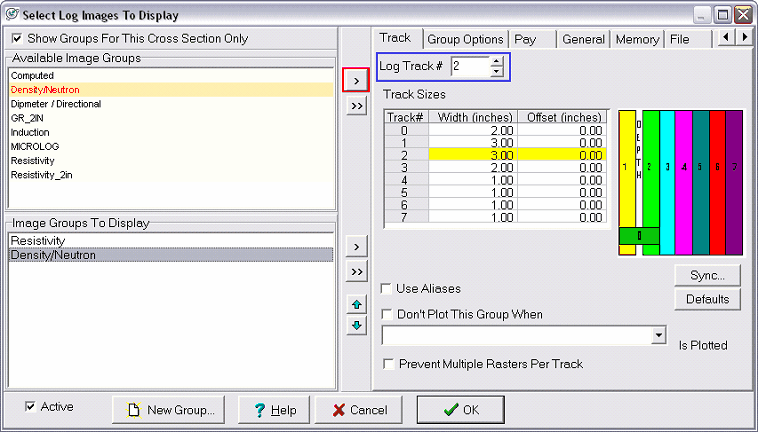
To select a group for display, first select the raster group and click the ">" button (highlighted in red in the example above). This brings the group name into the "Image Groups to Display" window on the bottom of the screen.
In general, it's best to display your highest resolution raster logs when you have a choice. When placed on cross section, Petra scales all logs to same size. Squeezing a 5" raster log to fit a 1" space retains much more detail than stretching a 1" log to fit a 5" space.
Next, click on the group name in the "Image Groups to Display" box, and select a track with the "Log Track #" box (highlighted in blue in the example above). This track number sets the raster log's position relative to each well's depth track. For reference, track locations are given on the far right side of the box. Track 1 is immediately to the left of the depth track, while track 2 is to the right of the depth track. The widths of these tracks can be modified by clicking on the width and typing the desired number. In the example above, the "Resistivity" group is in track 1, and the Density/Neutron group is in track 2. These tracks have been modified to be 3 inches wide.
While still in the "Select Log Images to Display" box, click on the General tab. There are a few options that can tweak the appearance of your cross section.
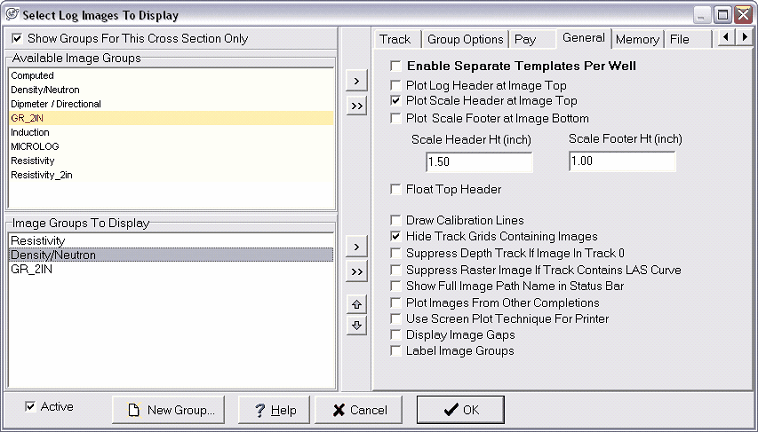
In this case, we can elect to plot the scale header at the top of the raster log. Scale headers are set during depth registration. Commercial vendors rarely set up a Petra-recognizable scale header, so you'll likely have to establish this yourself for more information on this and other depth calibration, see here.
Additionally, track grids are useful for showing digital data, but get in the way of raster data. Click "hide track grids that contain raster images." Click OK.
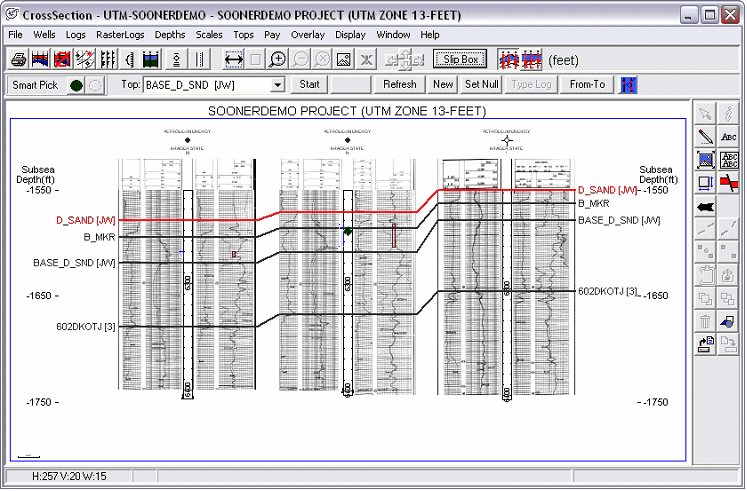
Following the example, the resistivity log is plotted to the left of the depth track, and the porosity logs are plotted to the right.
Dealing with Runaway Raster Group Names
In a simple case with only a few consistently-named raster groups, placing rasters inside a cross section is fairly straightforward. In larger projects, however, there are some significant practical hurdles to using raster logs.
One of the biggest challenges to working with raster images is the inconsistency of group names assigned by commercial sources. This inconsistency means that even a relatively small Petra project can contain hundreds of raster group names. For instance, "Comp Resistivity Neutron Density 2.5IN" and "Comp Neutron Density CAL 2.5" are almost certainly the same type of log, but they have two different group names. Additionally, multiple logging runs for the same well can put different depth intervals in different group names. The quality of the scanned images can vary as well, where the same group name in different wells can be of very different quality. With hundreds of names, multiple runs, and wildly differing quality of scans, selecting a standard set of raster logs suitable for all cross sections in a project can be very difficult.
Petra has two major ways of dealing with this problem: aliasing and individual raster templates.
Aliasing
Much like aliasing of digital logs or tops, aliasing of raster groups establishes a list of raster group names that are equivalent. In the event that the selected raster group is not found, Petra moves down a list of other raster groups.
Aliasing is fairly quick and easy, but a single master alias list might not provide the best results for every well for the reasons outlined above. For example, in one well group A is the highest quality log. In another well, log group B is the highest quality log. A single aliasing list won't be able to make this distinction between the two wells, and will simply plot the first log on the aliasing list regardless of quality.
To set up an aliasing list, in the Rasters tab in the Main Module, click on "Group Maintenance" on the bottom of the screen (highlighted in red).
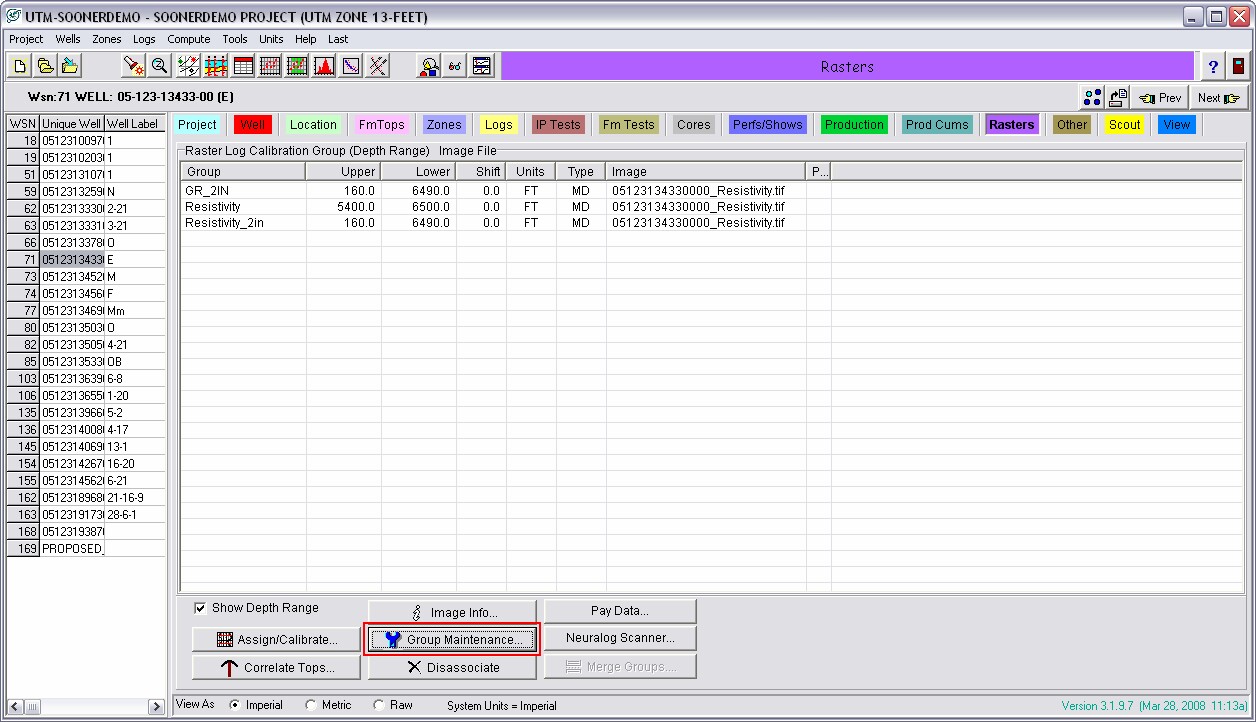
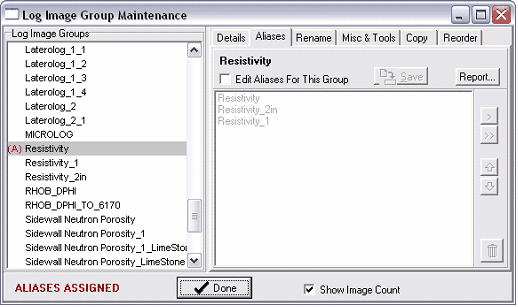
This brings up the Log Image Group Maintenance box. Go to the Aliases tab.
Select the raster group you want to alias. This should be your best single log group or a group with a large number of images. Next, click the checkbox for "Edit Aliases For This Group." This enables you to click on and add other groups to this alias list. It's possible to rearrange groups inside this list using the blue up and down arrows on the right side of the screen. Once completed, click "Save." In the example below, the "Resistivity" group is aliased with "Resistivity_2in" and "Resistivity_1." In other words, when the "Resistivity" group isn't present, Petra will attempt to draw the other two raster logs instead.
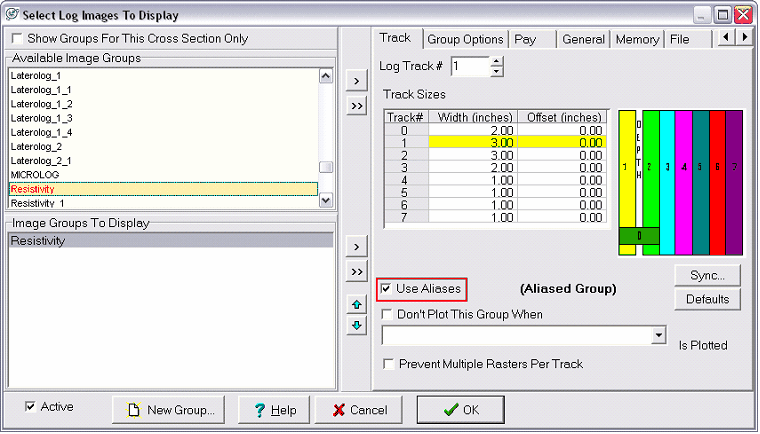
To turn on aliasing in the cross section module, go to RasterLogs>Log Images Display. After a group is selected, click on the "Use Aliases" box (outlined in red).
Individual Raster Templates
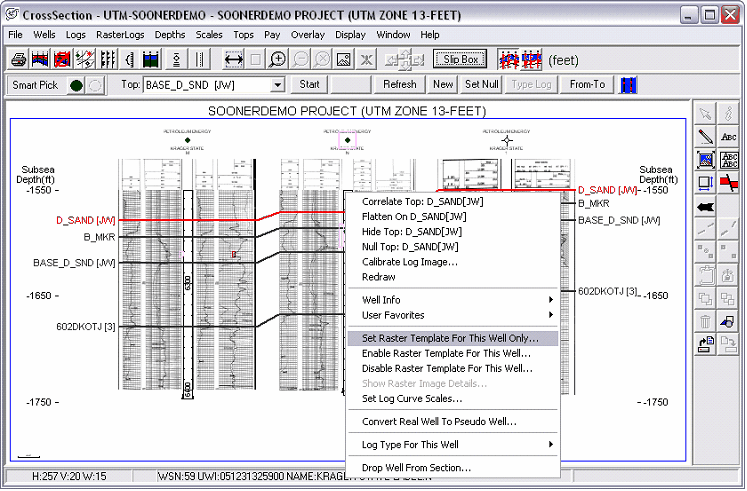
In addition to setting raster logs for an entire cross section, it is also possible to set raster logs for an individual well in a cross section. Using an individual well template allows you to select the best logs for each well irrespective of the global raster settings. This is a great solution, but it requires individual attention for each well modified. Generally, a good approach with individual templates is to establish a decent aliasing scheme, and then create individual templates for wells that do not fit the aliasing suitably.
To change an individual well's raster template, first select the well by left clicking on the well symbol or the depth track. Notice how the well symbol is highlighted with a pink box when selected. Next, right click to bring up the menu. Select "Set Raster Template for This Well Only
"
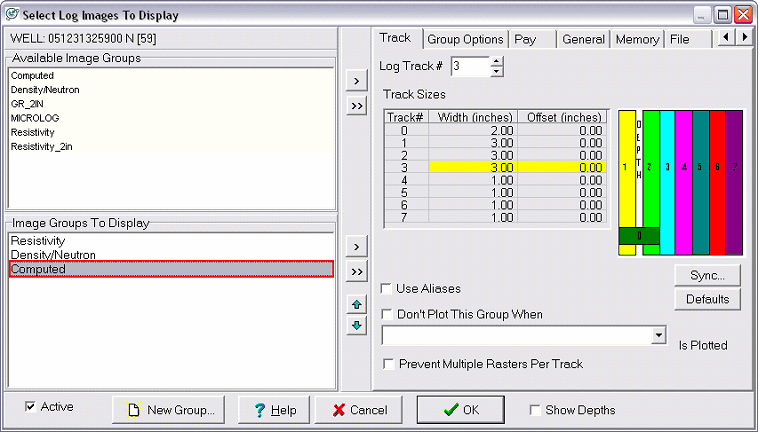
This brings up the "Select Log Images to Display" box. It is exactly the same as the "Select Log Images to Display" for the entire cross section, but only pertains to one well. Here, you can add or change the settings of the raster groups for the selected well. Following the example, we've added the "Computed" curve, a computer-calculated effective porosity and water saturation log for the middle well. This raster group will go in track 3 on the far right.
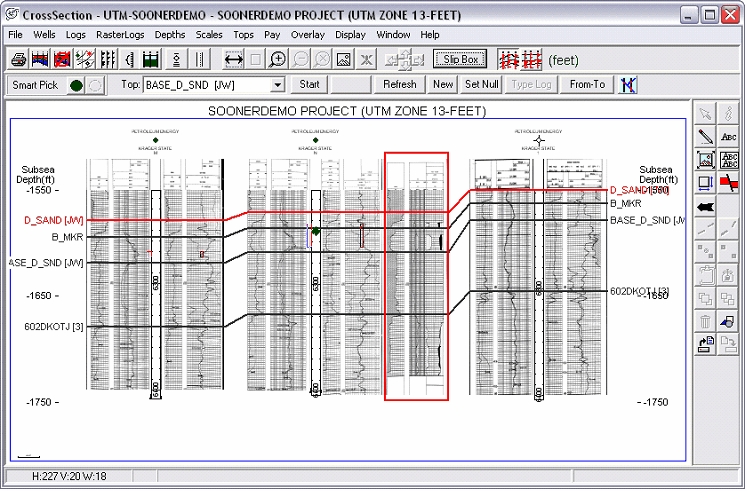
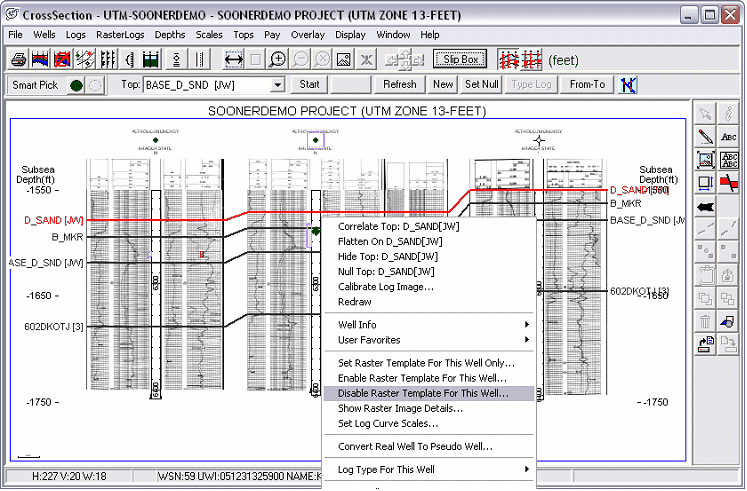
Turning off individual well templates is just as easy. Just select the well by left clicking on the well symbol or the depth track as before. Next, right click to bring up the menu and select "Disable Raster Template for This Well
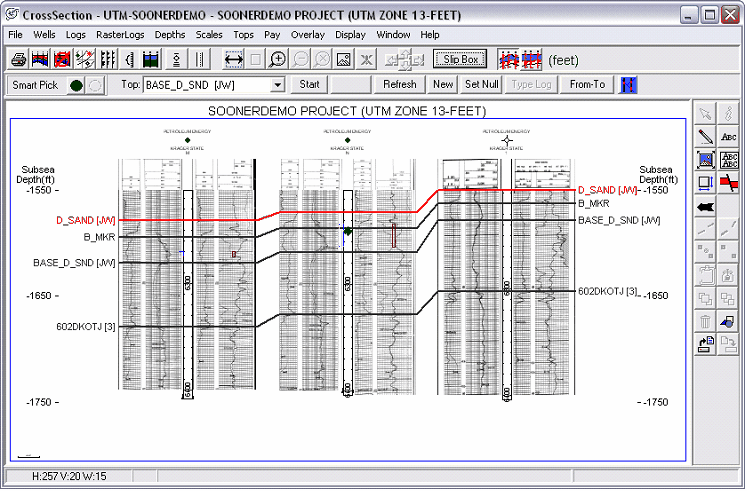
" This turns off the individual template and defaults to the regular cross section raster log template.
|