|
Grid Directory
|
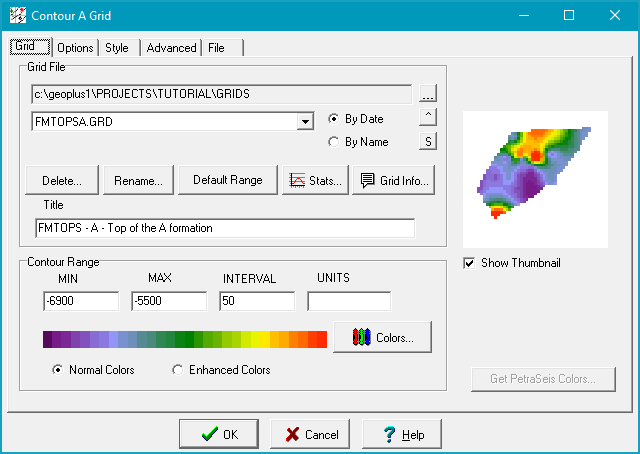
This window displays the currently selected grid directory. By default, Petra will look in the project's GRIDS folder. To change this folder, select the "..." button to the right. This grid directory affects the grids displayed on the following dropdown menu; if a grid isn't showing up, make sure to check that the folder containing the desired grid is selected.
|
|
Grid Dropdown
|
This dropdown lists all the available grids in the selected grid directory; if a grid isn't showing up, make sure to check that the folder containing the desired grid is selected. These grids can be arranged by creation date, or by file name in alphabetical order. Note that the selected grid's title shows in the "Title" window at the bottom of the Grid File Section.
|
|
Delete
|
Deletes the currently selected grid.
|
|
Rename
|
Rrenames the currently selected grid
|
|
Default Range
|
Automatically set the contour range based on the minimum and maximum values in the grid
|
|
Stats
|
Displays a histogram and other statistical data about the z values in the grid.
|
|
Grid Info
|
Displays information about the grid file, including creation date, grid size and location in XY units, and map projection details
|
|
Title
|
Grid title located on top of map/grid.
|
|
Contour Range
|
·Min - Minimum contour value.
Max - Maximum contour value
·Interval - Interval between different contours and colorfils. Plain lines can handle an unlimited number of contour intervals. For color filled contours, a "Normal" Color bar can use a maximum of 46 contour intervals and an "Enhanced" Color bars can use a maximum of 512 contour intervals.
·Units - Units of the contour lines.
|
|
Colors...
|
This button changes the Color bar for the grid contours. Petra has two ways of displaying color on computer-created grids: normal and enhanced.
·Normal Color bars have greater flexibility in changing colors and irregularly spaced intervals, but tends to be a little more work to set up and has a more limited total number of intervals.
·Enhanced Color bars are generally simpler than the normal method and allows a greater number of color intervals (512), but can only handle regularly spaced intervals and is less flexible in interpolating between colors.
|
|
Show Thumbnail
|
This option displays a small picture of the grid. This can be useful for checking the contour interval and Color bar settings.
|