3DViz Log Display Options

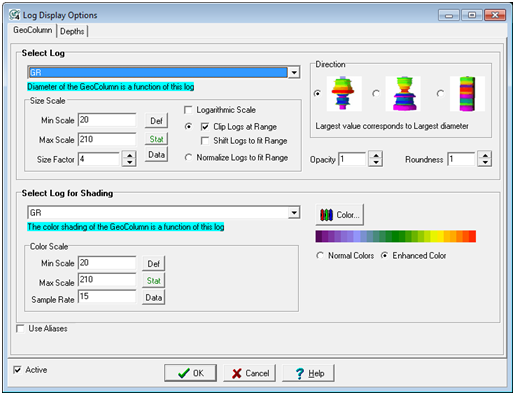
Petra displays logs with "geocolumn" shading, as multi-colored cylinders around the wellbore.  The 3DViz Module varies the cylinders size and color based on log values.

To modify how digital logs are displayed:
  • Select the button on the on the Layer Toolbar.
  • 3dViz Module: Wells > Curves....

GeoColumn tab

The 3DViz module can draw digital logs in two different ways - by varying the diameter of the cylinder and the color.  These two are independent and can color the selected log trace using values from another log curve. This option can be useful for plotting a litho-column type display.

Select Log—The selected log is drawn by changing the diameter of the well bore and coloring it to match the desired shading log.

Size Options

Determines the maximum size of the log based upon the bore hole diameter.

  • Logarithmic Scale: Check this option to plot a log using log 10 value. The left and right scales should be entered as powers of 10 when using this option.
  • Clip Logs at Range: Checking this option causes the log trace to be truncated at the track boundaries whenever the log value is beyond the range defined by the min and max scale.
  • Shift Logs to Fit range: Checking this option shifts the data of the selected log such that the mean value of the log trace coinsides with the mean value of the selected range defined by the min and max scale.
  • Normalize Logs to Fit Range: Check this option to normalize selected log data to fit the range defined by min and max scale.

While normalize logs to fit range is selected, cliping and shifting log trace option is disabled and vise-versa.

Direction

Determines the dimension for the largest log value.

  • Opacity: Set the opacity of the logs ranging from 0(transparent) to 1(opaque)
  • Roundness: Set the roundness of the logs ranging from 1(minimum) to 6(maximum)

Select log for Shading—Determines the colors of the depth values of the log curve. This defaults to the same log as used for the diameter scaling.


  • The min and max default to the values in the log curve.
  • The sample rate is used to desample the log curve for clarity of color.
  • Choose the type of color bar desired and click the color button to select the desired colors

Color

  • Select the type of color bar:
    • Normal colors
    • Enhanced colors
  • Color button selects the desired colors.

Depths tab

The Depths tab sets the depths of the logs displayed on the 3DViz log.  Selecting the "Set Depths..." option opens the Set Depth Range tool.