Map Monthly Production Chart |
|
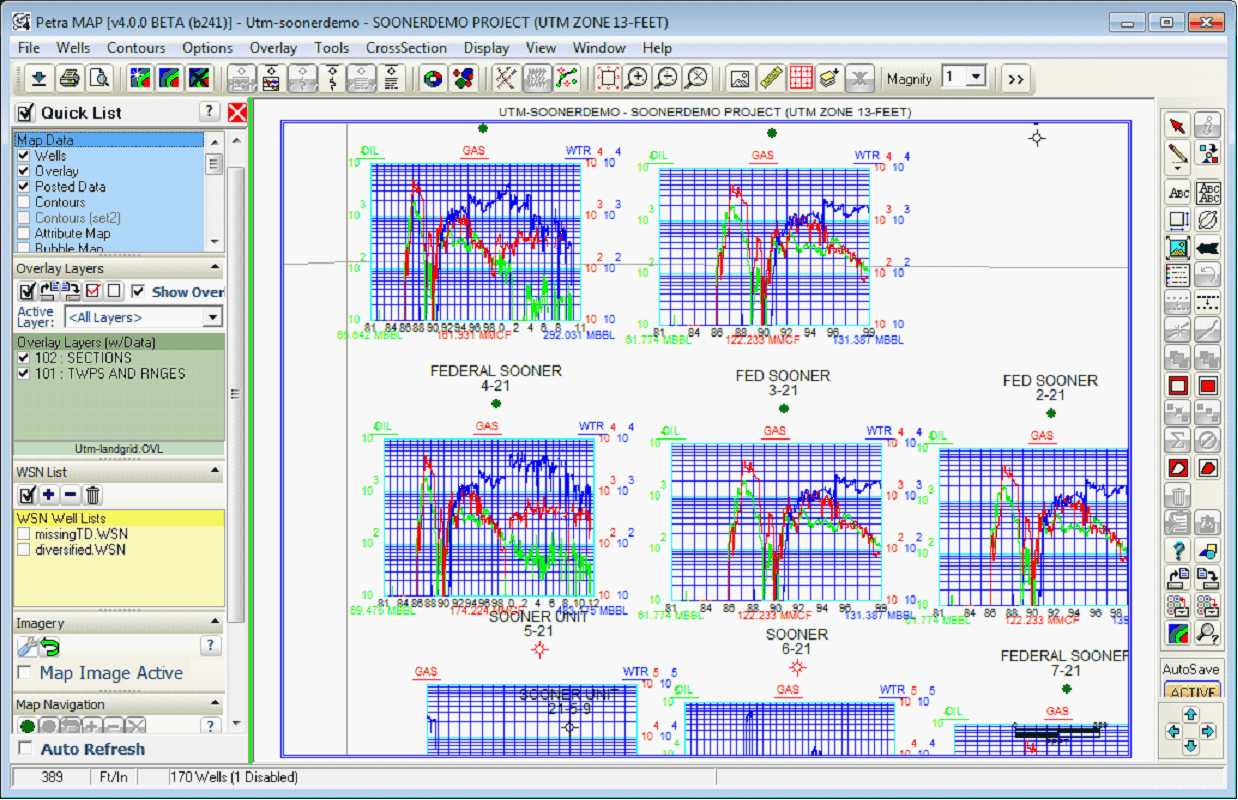
The monthly production chart displays up to 3 monthly production variables as a small graph next to the selected wells. To set up monthly production charts select the
The Map Module with Monthly Production Charts
|

