|
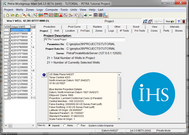
Petra consists of a Main module and several specialized tool modules. The Main module provides most of the well data for viewing, editing functions, and calculation options. Main also launches the other tool modules and coordinates inter-task communication between the tools. Each tool module is launched from its associated icon on the top of the main module.
Main module
The Main module provides the basis for all functions in Petra including creating, opening and closing projects. Main provides screens for viewing and modifying all well data, and provides many data calculation functions, including isopach, footage summations from log data, production cumulative values, and user-defined equation evaluations.
Organized into a list of wells on the left and a series of tabs on the right, each tab section displays details of a specific data type for the well. Clicking on different wells in the well list provides the wells details in the tab sections. Any data in the tabbed sections may modified by simply typing over the data. Each tab contains a "save" button which must be clicked to change the data in the database. Petra will automatically prompt you to save the data if you change data then click to a another well.

Tool modules
The Main module's toolbar provides links to Petra's specific Tool modules as well as links for opening and closing projects
Individual tool modules are launched from icons located at the top of the main module or the main module Tools menu.
Module toolbar

|

|
Map Module
|
The Map module displays a map of the project area that can include wells, culture data, bubble maps, and attribute maps. The Map Module also creates grids of geological surfaces or any other data that varies aerially.
|
|

|
Cross Section Module
|
The Cross-Section Module displays a profile view of a selected set of wells, generally with some combination of wireline log data, formation tops, and completion data.
|
|

|
Spreadsheet Module
|
The spreadsheet tool allows you to edit data from the database in spreadsheet format.
|
|

|
Log Cross Plot Module
|
This module creates a cross plot between two or three digital log curves. The area covered by the petro physical relationship of the curves can be used to encode specific lithology or fluid relationships.
|
|

|
Z Cross Plot Module
|
This module creates a cross plot between 2 zone or formation tops. The Z Cross Plot Module can calculate a variety of regression equations or create polygons based on the cross plot relationship.
|
|

|
Histogram Module
|
This module creates a histogram of a selected digital log curve. Can be filtered by other log curves, by depths, or by formation tops.
|
|

|
Decline Curve Analysis Module
|
This module displays monthly production data for individual wells. This module can also predict reserve estimates.
|
|

|
Production Group Plot Module
|
This module displays aggregate monthly production for one or multiple wells. This production can be normalized by reservoir and start date/earliest max production to provide an "average" producer for a specified reservoir.
|
|

|
2D Seismic Module
|
This module provides the ability to import 2D and 3D seismic locations and horizon z data
|
|

|
Thematic Mapper Module
|
This module imports, displays, and manipulates ESRI Shape Files based on attribute data. The Thematic Mapper Module can then send the results to the Mapping Module's overlay feature.
|
|

|
3D Visualizer Module
|
This module displays well paths, grids, and overlay data in an interactive three dimensional environment.
|
|

|
Slip Logs Module
|
This module displays two or more raster logs horizontally for formation top correlation.
|
|

|
Log Correlation Module
|
Like the Cross Section Module, this module displays wire line logs for several different wells. With fewer display options, this module is geared to rapidly correlate formation tops across a field.
|
|

|
Directional Well Module
|
This module is useful both for planning horizontal wells and for displaying log and well data for existing horizontal wells.
|
|


