|
The process of log normalization calibrates curves for several wells to a common scale. Typically, curves are calibrated using one of two methods; base line shift or scale range adjustment sometimes called sensitivity calibration. A base line shift adjusts the curves to a common scale by subtracting out the curve's current baseline and adding back in the desired base line value. Scale range adjustment attempts to calibrate the curves to have a common minimum and maximum value over the over the normalization depth interval.
For a longer discussion of log normalization, see the Log Normalization Overview.
Data tab
The data tab section contains the input and output log curve selections and the normalization depth Zone.
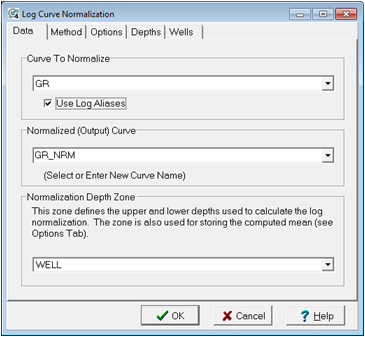
Curve To Normalize - This dropdown selects the curve to normalize. This original curve will remain unchanged, and the normalized version of the curve will be copied to the "output curve selected below.
Use Log Aliases - This option uses log curve aliases for the input log curve to normalize. In practice, this option will attempt to replace the missing log curve name with one of the other "equivalent" logs on the alias list.
Normalized (Output) Curve - Select or enter a new curve name which will contain the results of the normalization.
Normalization Depth Zone - This option sets the upper and lower limit of the normalization based on a zone's interval definition. Ideally, this zone should restrict the normalization to a lithologic package in which the log curves have a common reading from well to well. Large depth intervals can skew results.
Method tab
The method section determines which type of calibration is done. The Options tab section sets more details for each method.
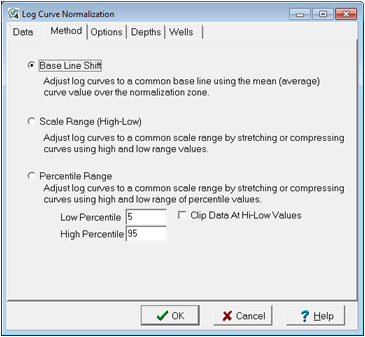
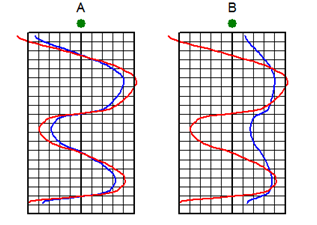
Base Line Shift - This method adjusts each curve by adding or subtracting a constant to the curve's values. In other words, this option simply shifts the curve left or right in order to fit each curve to a specified baseline. This baseline can either be a computed average or a user-set value. This method only changes the magnitude of the curve values, the shape of the curve remains the same.
In the example below, well A's original curve (blue) is very close to the overall baseline (in the middle of the track) while well B's original curve reads high and to the right relative to the baseline set in the middle of the track. Well A's normalized curve (red) doesn't shift too much, while well B's normalized curve shifts to the left.
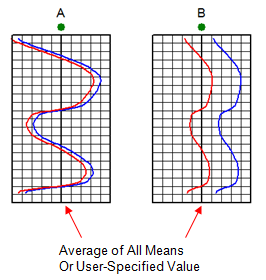
A Base Line Shift applied to two curves in two wells (A and B). The original curves are in blue, and the normalized curves are in red
Scale Range (High-Low) - This method adjusts each curve to have a common minimum and maximum value. This option effectively stretches and squeezes the curves to use a new range, which can change both the magnitude and shape of the curve. This method is best used to normalize old, less sensitive logs with newer, more sensitive logs. This method can adjust the curves to the computed average minimum and maximum values of all curves or to a user-defined range. This method can produce a "blocky" curve that often benefits from the Advanced Transform Module's Smooth Logs tool.
In the example below, well A's original curve (blue) covers most of the range set by the left and right edges of the track, while well B's original curve covers a smaller range. Well A's normalized curve (red) expands a little so that the maximum and mimimum reach the edges of the track, while well B's normalized curve expands and shifts a lot more.
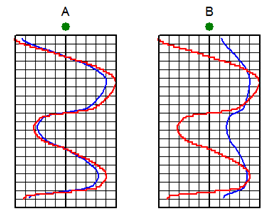
A Scale Range Shift applied to two curves in two wells (A and B). The original curves are in blue, and the normalized curves are in red
Percentile Range - This method adjusts each curve such that two given percentiles have a common minimum and maximum value. By using a percentile rather than the absolute maximum or minimum, this method is less prone to anomalous effects caused by washouts or other data spikes. This option effectively stretches and squeezes the curves to use a new range, which can change both the magnitude and shape of the curve. This method is best used to normalize old, less sensitive logs with newer, more sensitive logs. This method can adjust the curves to the computed average minimum and maximum values of all curves or to a user-defined range.
In the example below, well A's original curve (blue) covers most of the range set by the left and right edges of the track, while well B's original curve covers a smaller range. Well A's normalized curve (red) expands a little so that the P5 and P95 reach the edges of the track, while well B's normalized curve expands and shifts a lot more. Notice that the minimum and maximum extend beyond the set ranges.
A Percentile Range Shift applied to two curves in two wells (A and B). The original curves are in blue, and the normalized curves are in red.
Options tab (Base Line Shift Method)
The Base Line Shift method provides two choices for normalization.
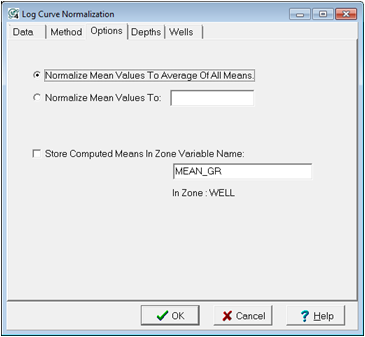
Normalize Mean Values to Average Of All Means - This option shifts curves to the computed average value for all wells.
Normalize Mean Values To - This option shifts curves to a user-defined value.
Store Computed Means In Zone Variable Name - This option stores the computed mean values for the original curve in a data item in the zone selected on the Data tab. This can be useful for for mapping or troubleshooting later. By default, Petra will store the mean in a data item called "MEAN_GR." To change this data item, enter a new data item name.
Options tab (Scale Range Method)
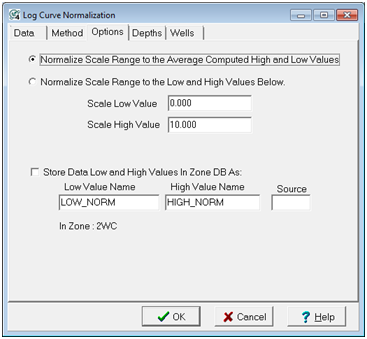
Normalize Scale Range to the Average Computed High and Low Values - This option stretches the curves so that the maximum and minimum of each curve matches the average maximum and minimum curves of all curves.
Normalize Scale Range to the Low and High Values Below - This option stretches the curves so that the maximum and minimum of each curve are the "Scale Low Value" and "Scale High Value" entries.
Store Data Low and High values In Zone DB As - This option stores the computed high and low values for the original curve in two data items in the zone selected on the Data tab. This can be useful for for mapping or troubleshooting later. By default, Petra will store the high and low values in data items called "LOW_NORM" and "HIGH_NORM." To change this data item, enter new data item names.
Depths tab
This tab controls how Petra limits the normalization process to a specific depth interval, and how Petra overwrites existing log curves.
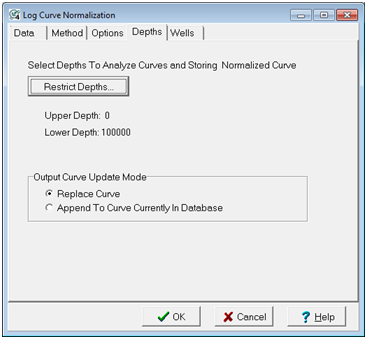
Restrict Depths
This options opens the "Set Depth Range" tool, which controls the upper and lower limits of the normalization process. The depth interval can be specified in measured depth, TVD, or relative to formation tops.
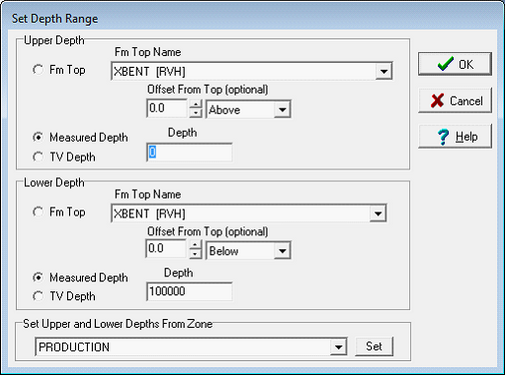
The Set Depth Range
In the Set Depth Range box, select the relevant top, MD, or TVD button. For MD and TVD, select the relevant button and enter the adjacent depth in the entry field. For tops, select the desired top from the Fm Top Name dropdown box. Notice that an offset can also be added or subtracted to the fm top; this offset will include data points above or below the actual fm top depth.
To set depths by a zones interval definitions, select the desired zone on the Set Upper and Lower Depths From Zone dropdown menu. Note that the WELL zone by default covers -1M MD to +1M MD, so it should cover the entire footage of all wells.
Output Curve Update Mode
This option controls how Petra overwrites curves already in the database. This can be important for normalizing the same curve over two or more different intervals.
Replace Curve - This option completely replaces the curve in the database with the latest normalized curve.
Append to Curve Currently In Database - This option simply adds the newly normalized curve to the existing curve. Where the new curve overlaps the existing curve, the new curve will overwrite older curve data.
Wells tab
The Wells tab specifies which wells will have their curves normalized.
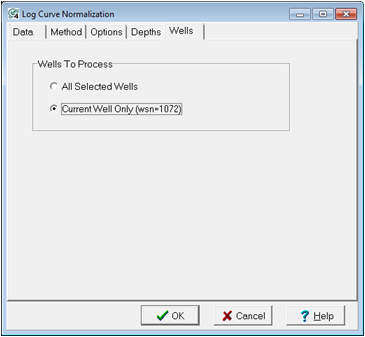
All Selected Wells - This option will normalize the curves for all wells currently selected in the Main Module
Current Well Only - This option will normalize the curves only on the single well highlighted in the Main Module.
|