|
Every overlay line has a series of attributes that define the type of line and its appearance.
To edit a line's attributes, select the red arrow button, and double-click a node on the desired line.
General tab
The General tab sets the basics of the line, including its layer and class.
The Overlay Line Attributes General tab
Layer - This dropdown sets the layer that will contain the line. Since the Map Module can selectively display or hide entire layers, related lines (such as land grid or lease outlines) should generally be in the same layer. Each set of contour lines should have its own layer.
Line Class
While normal lines are just for displaying visual information (like section outlines or roads), contour, unconformity, and fault lines can also be used to influence the gridding process.
Normal Line- Normal lines have no specific attributes beyond a color and fill. Normal lines are useful for display purposes, including lease lines and arrows.
Contour Line- Contour lines have a specific value, and are useful for modifying Petra's gridding process. Selecting the "Contour Line" class enables the Contour tab, which sets the specific line's value. For more information on using contour lines during gridding see the "Hybrid Method" under "How to Make a Contour Map."
Unconformity Line - Unconformity lines illustrate an unconformable surface contact with a squiggly line on the map.
Fault Trace - Fault traces break grids into two separate parts. Selecting the "Fault Trace" class enables the Faults tab, which sets the strength and appearance of the fault. For more information on using fault lines during gridding see the "Hybrid Method" under "How to Make a Contour Map."
Line Width - This dropdown sets the line widths for drawing the line. Line widths range from narrow to extra-wide. This dropdown also can select the 4 custom "User-1" through "User 4" line widths. These line widths can be modified on the Petra Program Options'Font/Graphics tab in the Main Module.
Line Style - This dropdown sets the line to use one of the predefined drawing styles to draw a solid or dashed line.
Smooth Line Points - By default, Petra draws a straight line between the node points that make up a line. This option instead draws a smoothed line through the line's nod points.
Closed Polygon - This option forces the starting and ending points to match when drawing polygons. This switch should be specified when using area fill options.
Contour Clipping Polygon - This option tells Petra to use the polygon to clip gridded contours. Grids outside the polygon will not plot. This can be useful for trimming off anomalous or otherwise bad parts of grids.
Allow in Map Gutter - This option allows the line or polygon to be plotted in the gutter, which is set on the Map Module's Data Map Margins and Preferences tool.
Line is Invisible - This option prevents the line from displaying on the Map Module, even when the layer containing the line is visible. Invisible lines can still affect gridding, and can still be selected.
Colors tab
The Overlay Line Attributes General tab
Line Color - This dropdown sets the color of the line. For closed polygons, this will set the shape's outline. To change the available colors on this dropdown, select the "Palette..." button. To restore the default colors, select the "Default" button.
Fill Color - This dropdown sets the color of the fill inside a polygon. To change the available colors on this dropdown, select the "Palette..." button. To restore the default colors, select the "Default" button.
Drawing Mode
Normal - This option draws the line or polygon element with an opaque color. Lines or polygons with a normal drawing mode will cover elements that are below them.
Transparent - This option draws the line or polygon with a transparent color. With a transparent drawing mode, other elements will be visible through the line or polygon.
Combine Colors - This option will display overlapping lines and polygons with a different color. In practice, this option is a great way to demonstrate regions of overlap on the overlay.
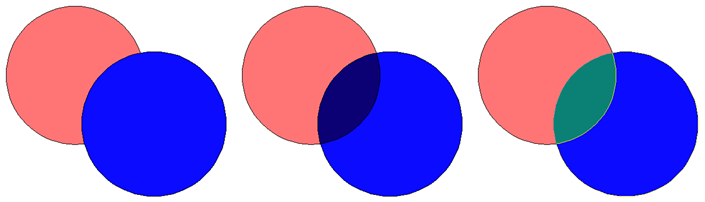
The blue circle on top with Normal (Left), Transparent (Center) and Combine Colors (Right) drawing modes
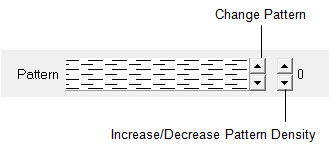
Patterns
Petra can draw patterns inside polygons. The left up/down button sets the pattern, while the right up/down button sets the density of the pattern.
Pattern Color - This dropdown sets the color of the pattern inside a polygon when the "Use Pattern Color" option is selected.
Pattern Line Mode
Use Thin Black - This option draws the selected pattern using thin black lines. This option will override the "Pattern Color" dropdown.
Use Line Color & Width - This option draws the selected pattern using the line color (selected on the Colors tab) and thickness (selected on the General tab). This option will override the "Pattern Color" dropdown.
Use Pattern Color - This option uses the color set by the Pattern Color dropdown immediately to the left.
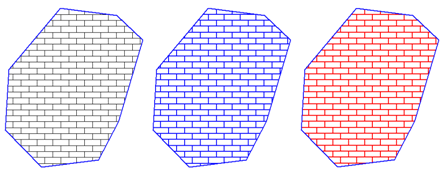
Pattern Filled polygons with "Use Thin Black" (Left), "Use Line Color & Width" (Center), and "Use Pattern Color" (Right)
Area Fill tab
The Area Fill tab controls how Petra fills polygons.
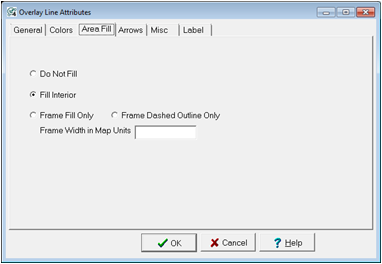
The Overlay Line Attributes Area Fill tab
Do Not Fill - This option will turn off any polygon fill.
Fill Interior - This option will fill the polygon with the "Fill Color" selected on the Colors tab.
Frame Fill Only - This option will only fill the outermost edge of a polygon. The thickness of this fill is set by the "Frame Width in Map Units" option.
Frame Dashed Outline Only - This option will create a dashed outline inside the polygon. The distance between the outer edge of the polygon and the inner dashed fill is set by the Frame Width in Map Units option.
Frame Width in Map Units - This option determines the option determines the width of the shading inward from the polygon borders. The frame width is specified in the currently selected map units (feet or meters). This is commonly used to display partial ownership of a lease.
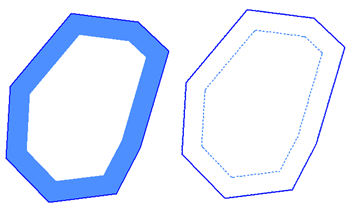
The Frame Fill Only option (Left) an the Frame Dashed Outline Only (Right)
Volm tab
The Volm tab sets up a closed polygon as a volumetric polygon. Petra can use these polygons during volumetric calculations.
Volumetrics Polygon Name - This entry sets the name of the volumetric polygon. Generally, this will be the lease name.
Plot Polygon Name - This option plots the volumetric name in the center of the polygon.
Working Interest Applied to Volumetrics Calculations - This option sets the working interest of the polygon. Petra can multiply the volumetrics calculation by the working interest set here.
Designate a Well to Store Computed Volume for this Polygon - This entry sets a "designated well" that will store the computed volume for the polygon. Note that this entry uses the WSN rather than API/UWI numbers.
Note that volumetric polygons can also have an area plotted on their label. See the Overlay Layer Preferences'Misc tab for more information.
Contours tab
This section sets individual contour line values and settings. This section is only available when the "Contour Line" class is selected on the General tab.
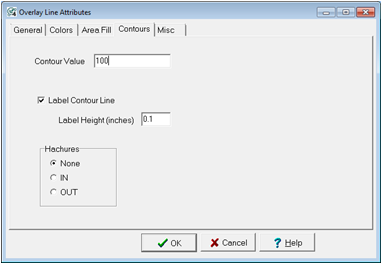
The Overlay Line Attributes Contours tab
Contour Value - This entry sets the value for the contour line.
Label Contour Line - This option ensables or disables contour line labeling.
Label Height - This option sets the height of the contour label in inches.
Hachures - This option adds hachures to inside or outside of a contour line.
Faults tab
This section controls how Petra handles a fault line. This section is only available when the "Fault" class is selected on the General tab.
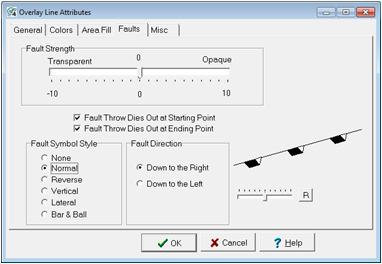
The Overlay Line Attributes Faults tab
Fault Strength - The strength of a fault affects gridding. The more transparent a fault trace is, the less effect it has on the grid. Totally opaque faults do not allow the gridding process to use data points which are on the opposite side of the fault from the grid node being computed. Set the fault strength somewhere between Transparent and Opaque.
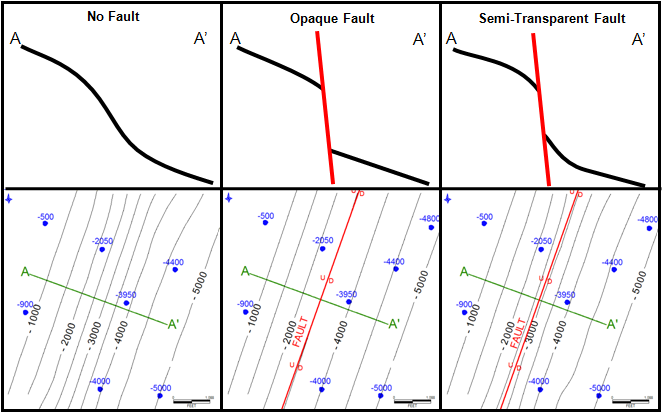
Fault strength's effect on throw and fault drag
Fault Throw Dies Out At Starting Point - The starting point of a fault is the first point digitized. Set this option if the throw is zero at the starting point.
Fault Throw Dies Out At Ending Point - The ending point of a fault is the last point digitized. Set this option if the throw is zero at the ending point.
If the throw does not die out at either end point, the gridding algorithm treats the fault as totally opaque.
Fault Symbol Style - This option adds fault symbols to the line. Note that the size of the fault symbols can be increased or decreased by the slider bar on the right side of the window. Importantly, these fault symbols are purely cosmetic and have no bearing on the gridding process.
Fault Direction - This option controls how Petra draws fault symbols on the line. "Down to the Left" and "Down to the Right" are relative to the starting point and the ending point. A rule of thumb is to assume you are standing on the start point and looking out towards the first segment - what is on your left is left, and what is on your right is right.
Arrow tab
This section allows arrow heads to be added to the line end points. Note that Petra can only draw arrows on lines with a "Normal Line" line class selected on the General tab.
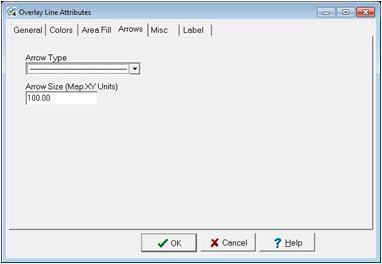
The Overlay Line Attributes Faults tab
Arrow Type - This dropdown sets the appearance of the arrow. Note that the arrows are directional. An arrow pointing to the right will put the arrowhead at the end of the line, while an arrow pointing to the left will put the arrowhead at the beginning of the line.
Size - This option sets the size of the arrow in map XY units.
Misc tab
The Misc tab controls a couple of additional options relating to overlay contour color fill and shifting an individual polygon.
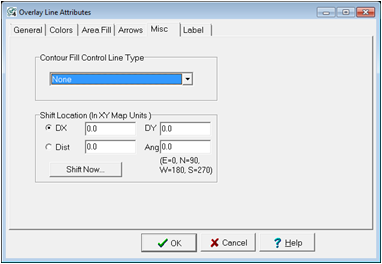
The Overlay Line Attributes Misc tab
Contour Fill Control Line Type
This section controls how the selected line is used with the Color-Fill Overlay Contours tool.
None - This option specifies that the selected line isn't a control or join line. Most lines shoudl keep this option.
Control Line - Control lines connect multiple contour lines.
Join Line - Join lines connect two otherwise disconnected contour lines to create a polygon.
Shift Location
This tool moves the selected line or polygon.
DX and DY - This tool shifts the line or polygon a set number of map XY units. For DX, positive numbers are east and negative numbers are west. For DY, positive numbers are north and negative numbers are south.
Distance and Angle - This tool shifts the line or polygon a set number of map XY units in a compass direction. The Distance is in map XY units, and the angle is in compass values (E=0, N=90, W=180, and S-270). This tool does not rotate the item.
Label tab
This tab adds a single label without using a dedicated text box.
The Overlay Line Attributes Label tab
Label Text - This entry contains the line's label for labeling the line. LEAVE BLANK for not labeling the line.
Stretch Label Over Percentage of Line Length (1-100%) - This determines the overall length of the plotted annotation. Large values will cause the text to be stretch out while small values will make the text appear compressed.
Text Height - This entry sets the height of the text in in XY map units.
Text Color - This option sets the text's color. The "Line" button sets the text to match the line color.
Position - This dropdown sets the placement of the line label as Above, Below, or On the Line.
Font - This dropdown sets the desired font for the annotation text.
|